


INTRODUCTION
In today’s digital era, social media has become a central arena for brand communication, interaction, and perception. Digital platforms not only shape how brands engage with their audiences but also serve as a barometer of public sentiment, campaign effectiveness, and overall brand vitality. Digital marketing continues to expand—projected to grow by 13% between 2024 and 2032—reflecting how nearly every marketing function has become digitally integrated (France et al., 2025). Consumers now expect all brands, across categories, to maintain a seamless digital presence, often engaging in paperless and contactless transactions that reflect a fully networked marketplace.
This transformation has introduced new performance indicators—such as social media sentiment, likes, share of voice, time spent on site or app, search visibility, and especially share of search, which measures a brand’s proportion of online interest within its category. While these digital metrics may not individually capture total brand value, when synthesized they provide a real-time complement to the lagged, survey-based measures traditionally used in brand equity research. As France et al. (2025) emphasize, digital indicators offer a timelier lens into consumer engagement and sentiment, enabling brands to monitor their intangible value dynamically rather than retrospectively.
Traditional approaches to brand equity—typically reliant on surveys, financial reports, or sales data—are increasingly outdated and incomplete in a digital context. (France et al., 2025) Surveys are costly, time-consuming, and ill-suited to detect rapid shifts such as reputational crises or viral surges in consumer sentiment. Moreover, the direction of information flow has inverted: consumers now seek and evaluate brands proactively rather than merely responding to advertising. This shift signifies a broader movement toward organic, user-driven interactions in which value is generated through consumer discourse rather than firm-controlled messaging. The proliferation of user-generated content (UGC) across social platforms, forums, and review systems has further transformed relationships from firm-to-consumer (F2C) to user-to-user (U2U) engagement, where consumers collectively construct brand meaning (Davcik et al., 2022). Consequently, digital and social listening represent not only an emerging opportunity but a methodological necessity for capturing the dynamic, real-time dimensions of brand equity that traditional methods overlook.
Luxury goods, as a category, span multiple industries and remain a resilient pillar of the global economy despite economic volatility (KPMG Advisors, 2024). The sector’s largest segments include luxury automobiles and personal luxury goods—such as apparel, accessories, watches, jewelry, and eyewear—which have exhibited sustained growth over the past decade (Statista, 2024). Bain & Company (2022) project that the personal luxury goods market will reach €540–580 billion by 2030, an increase of over 60% from 2022, underscoring the long-term vitality of the luxury industry.
The valuation of luxury brands has long posed a challenge at the intersection of marketing theory and financial practice. Luxury brands embody what Kapferer & Bastien (2012, p. 40) describe as “the symbolic, the timeless, and the exceptional,” demanding conceptual models that capture their multidimensional nature. Historically, two major theoretical perspectives have dominated: the consumer-based brand equity framework (Aaker, 1991; Keller, 1993), emphasizing consumer perceptions and behaviors, and the financial perspective, which considers the gap between accounting valuations and market capitalization (Ailawadi et al., 2003; Damodaran, 2006).
Contemporary research increasingly acknowledges that luxury consumption integrates symbolic, experiential, and relational dimensions (Berthon et al., 2009; Tynan et al., 2010). Vigneron & Johnson (2004) identified five key facets—conspicuousness, uniqueness, quality, hedonism, and extended self—that together define luxury’s appeal. Yet survey-based instruments such as the Brand Luxury Index (Vigneron & Johnson, 2004) have shown significant methodological weaknesses. Conejo et al. (2020) report that only about 30% of items perform consistently across contexts, highlighting issues of factorial instability, social desirability bias, and sampling limitations. Financially oriented indices, while useful, fail to capture the cultural and experiential dimensions that drive consumer preference (Chandon et al., 2016).
Meanwhile, digital transformation has radically altered how luxury brands create and communicate value (Hennigs et al., 2012; Okonkwo, 2009). Social media now functions as both a storytelling platform and a participatory space where consumers co-construct brand meaning (Kim & Ko, 2012; Phan et al., 2011). Emerging technologies, including AI-enabled personalization and conversational interfaces, further extend this interaction by blending human and digital touchpoints (Chung et al., 2020). As Arrigo (2018) observes, social media has redefined the traditional paradigm of exclusivity, creating new tensions and opportunities for luxury brands. Yet, as Veloutsou et al. (2021) note, academic research into luxury brand digitalization remains fragmented, underscoring the need for a coherent framework that integrates digital listening, consumer sentiment, and brand valuation.
This current research answers the call to create a methodology for capturing large digital data that reflects brand value through content sentiment and volume. In doing so we introduce a Luxury Brand Index (dubbed the l247 LBI). This methodology addresses unsolicited consumer opinions and engagement across digital platforms to provide a data-driven assessment of luxury brand value. Our approach builds upon three complementary theoretical foundations: consumer-based brand equity theory (Keller, 1993), market-based assets theory (Srivastava et al., 1998), and signalling theory (Boulding & Kirmani, 1993; Spence, 1973). These theories position consumer perceptions as the foundation of brand value, view brands as intangible assets that create shareholder value, and provide insights into how luxury brands communicate unobservable qualities through observable attributes.
The advent of this work connects unsolicited digital conversations to a data-driven weighting process aligned with observable market signals providing a link between real-time online engagement and established concepts of luxury brand value. While the l247 Luxury Brand Index (LBI) has been introduced in professional practice as a benchmarking tool, this research provides the first rigorous academic distillation of its underlying architecture. The novelty of this manuscript lies in the operationalization of 13 discrete digital variables—ranging from multi-platform Net Sentiment Scores (NSS) to behavioral search metrics—into a unified composite index.
LITERATURE REVIEW
From Traditional to Digital Brand Equity
Recent developments in brand research have emphasized how digital transformation is redefining the nature and measurement of brand value. France, Davcik, & Kazandjian (2025) developed the concept of Digital Brand Equity, highlighting that consumer–brand relationships have evolved within boundaryless, interactive, and real-time environments. In contrast to traditional models of brand equity that relied on lagged, survey-based or financial indicators (Aaker, 1991; Keller, 1993), digital brand equity is formed through dynamic consumer interactions across digital platforms, characterized by immediacy, empowerment, and interconnectivity leveraging a core element of branding through creating associations that bridge the digital landscape (Ekebas-Turedi et al., 2020).
Three major forces drive this shift (France et al., 2025). First, the digital environment has eliminated physical boundaries in communication and purchase behavior. Consumers now expect a seamless integration between online and offline brand presence—a reflection of omnichannel strategies that merge the brand’s physical and digital identities. Second, the proliferation of social platforms has empowered consumers to interact with brands at will, resulting in a redistribution of brand power from business-to-consumer (B2C) relationships toward consumer-to-consumer (C2C) and consumer-to-business (C2B) dynamics. In this organic environment, brand narratives are co-created rather than company-controlled. Third, the speed and global reach of digital markets have redefined expectations: services are delivered instantaneously, visibility is worldwide, and markets are no longer local but global.
Traditional measures of brand equity—such as sales data, consumer surveys, and financial performance metrics—fail to fully capture the intangible value generated in these real-time, digital interactions. France et al. (2025) argue that existing measures overlook indicators such as share of search, bounce rate, social sentiment, visibility, and online engagement—metrics that increasingly reflect brand awareness, preference, and loyalty in digital spaces. These digital signals, when correctly leveraged, complement lagged financial and survey-based measures by providing near real-time insight into brand performance.
A key contribution of France et al. (2025) lies in formalizing a conceptual model of digital brand equity as a function of three principal constructs: share of search (S), brand awareness (A), and brand sentiment (E), expressed as:
D=f(S,A,E)
where, digital brand equity (D) represents a brand’s intangible digital value. This framework highlights that consumer-driven digital activity—search behavior, online discussions, and sentiment tone—serve as powerful predictors of market visibility, reputation, and ultimately, financial performance. Notably, “share of search” reflects proactive customer interest and acts as a proxy for visibility, market importance, and consumer engagement with the brand category. Positive sentiment and user-generated content (UGC) further amplify reputation and purchase intent, while negative sentiment erodes it.
This digital shift has major implications for luxury brands. As the proposed l247 Luxury Brand Index (LBI) also draws from unsolicited online data—capturing Net Sentiment Score™, engagement, reach, and search behavior—its approach closely aligns with the digital brand equity framework. Both models recognize that brand value is now partially determined by real-time, consumer-driven discourse rather than firm-controlled communication. Traditional luxury brand equity has focused on symbolic and experiential attributes (Berthon et al., 2009; Kapferer & Bastien, 2012), but the digital environment introduces a participatory dimension, where UGC, social influence, and AI-mediated touchpoints redefine how value is perceived and measured.
Luxury Brand Value Indices
With the prominence of luxury as a brand and market category, there is sufficient need to both rank and track luxury brand performances. As such brand indices serve as composite metrics based on performance of brands in the luxury sector. The landscape of luxury indices is diverse, with some indices focusing solely on financial performance (e.g., S&P Global Luxury Index), while others focus on non-financial metrics (e.g., Altagamma Social Luxury Index), or combination of both (e.g., Vogue Business Index). Financially driven indices typically assess revenue, profitability, and market capitalization, providing insight into the financial health and market positioning of luxury brands. Non-financial metrics that can be considered for index formulation vary depending on the approach, some of them being Share of Voice, website traffic, consumer perception, sustainability efforts, and digital engagement. The not-strictly-financial, more holistic indices offer a broader understanding of luxury brands’ influence and cultural relevance, beyond just financial metrics. The review of available metrics and rankings presented here explores both financial and non-financial indices, highlighting the varying approaches to measuring luxury in today’s market.
-
S&P Global Luxury Index – Launched in 2011, The S&P Global Luxury Index consists of the data on 80 of the largest publicly-traded luxury goods or luxury services companies (S&P Dow Jones Indices 2026). The method used in this index is modified market capitalisation weighted. Rebalancing is done annually, and calculation daily. The top constituent of this index is Hermès.
-
MSCI Global Luxury Index – MSCI Europe Textiles, Apparel & Luxury Goods Index has data on 11 constituents. The method is market capitalisation weighted. LVMH is the top constituent of this index (MSCI, 2024).
-
STOXX Europe Luxury 10 – Focused solely on European luxury companies, STOXX Europe Luxury 10 index includes companies from luxury / fashion accessories industry, cosmetics and other care products, as well as high-class vehicles. The selection process uses Revere (RBICS) data to ensure companies have substantial exposure to luxury themes, with criteria such as liquidity, volatility, and market capitalisation. The index is rebalanced annually, with quarterly reviews for liquidity and volatility. Companies are weighted based on free float market capitalisation and a luxury multiplier, and a capping mechanism ensures no single stock exceeds 30% of the index (STOXX Limited, 2024, pp. 154–158). Top constituent of this index is Hermès.
-
Vogue Business Index – Unlike traditional indices that focus primarily on financial metrics, the Vogue Business Index is not based solely on financial data (Vogue Business, 2021). While it does consider companies’ financial results (annual revenue and revenue productivity ratios), it also factors in consumer sentiment, omnichannel capability, digital proficiency, as well as environmental, social and governance (ESG). The consumer sentiment includes analysis of brand awareness and association, perceived quality, consumer loyalty and purchase intent for each brand (Phronesis Partners, 2024). These are assessed based on surveying the specific type of consumers - the ones that spend more than $2,500 on luxury fashion annually. The digital proficiency represents assessment of brands based on Google search volume and site traffic, reach and engagement on major social media platforms (Facebook, Instagram, Youtube, X), search volume and brand page engagement on WeChat and engagement and popularity of runway shows on Vogue Runway (Vogue Business, 2021).
-
Luxe Digital Titans Ranking – While not exactly an index, Luxe Digital’s annual ranking of the most popular luxury brands online serves as a reference in the industry. Their ranking is based on a combination of share of search interest (calculated based on worldwide Google Trends data), website traffic and social media audience (sum of Facebook Fans and Followers on X and Instagram) and engagement calculated as monthly average of the annual total number of engagement actions across all tracked social channels (Luxe Digital, 2024).
-
The Digital IQ Index by Luxury Lab – This index uses several metrics to evaluate luxury brands, including website usability, e-commerce performance, digital marketing, social media engagement and brand visibility (Luxury Labs, 2009).
-
Altagamma Social Luxury Index – The Altagamma Social Luxury Index is made up of five pillars, tracking social presence, Share of Voice, sentiment analysis, reach and engagement and top authors resonance (Altagamma, 2019, 2020).
Each of the aforementioned indices offers different insights and exposure based on the specific methodologies, making them useful for different investment strategies and market analysis purposes. However, building a new index based on unsolicited customer opinion offers a much-needed innovative perspective in the landscape of luxury indices. Although some indices, such as the Altagamma Social Luxury Index, have begun to utilise this type of data, the unique and unbiased insights that can be extracted from this approach are far from exhausted.
METHODS
For the purpose of developing the l247Luxury Brand Index (LBI), unsolicited online posts and their associated metadata were collected for 20 selected luxury brands across multiple online sources. The initial data collection period extended from 29 March 2023 to 1 January 2024, with continuous harvesting implemented thereafter to support ongoing index updates. Data were gathered globally but restricted to content in the English language to ensure linguistic consistency and analytical comparability.
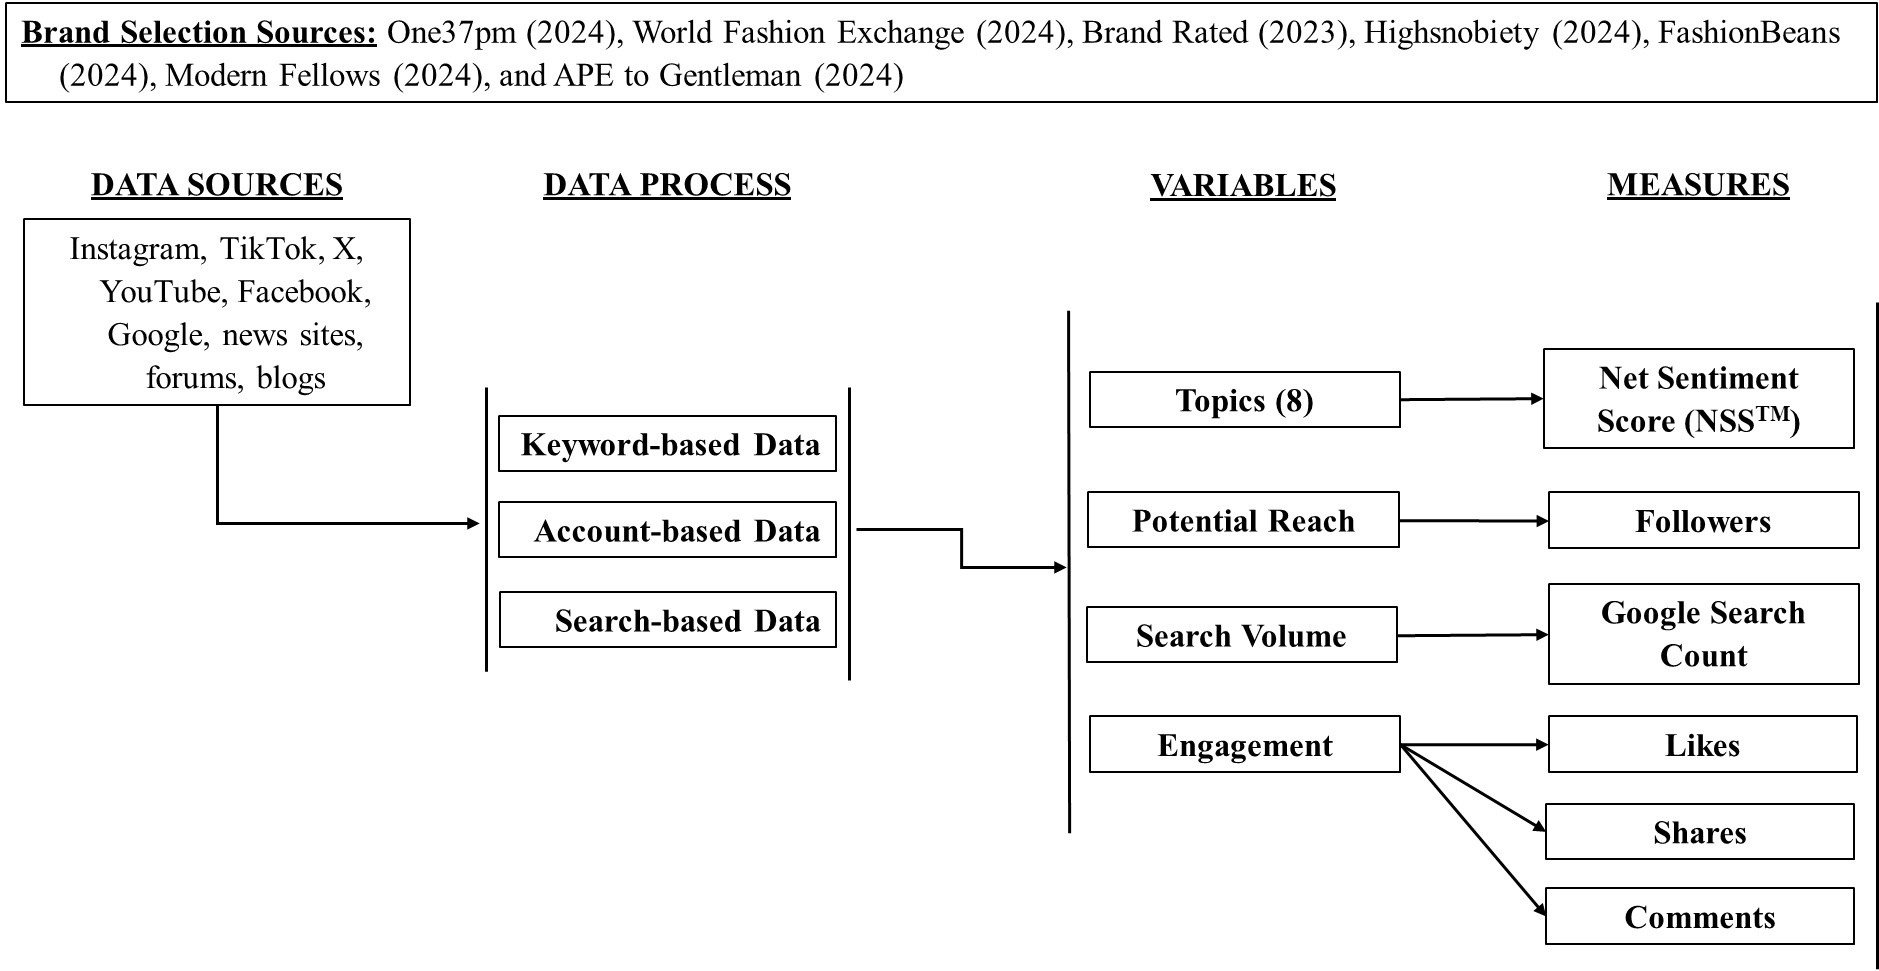
The selection of brands included in the index is based on a systematic review of luxury brand ranking outlets. This approach ensures a comprehensive and representative sample of brands that consistently demonstrate prominence within the luxury sector. Seven sources were analyzed—One37pm (2024), World Fashion Exchange (2024), Brand Rated (2023), Highsnobiety (2024), FashionBeans (2024), Modern Fellows (2024), and APE to Gentleman (2024)—to identify recurring brand names. Brands that appeared most frequently across these independent rankings were selected to ensure visibility, prestige, and global relevance, reflecting the criteria that underpin market leadership in the luxury industry (see Table 1).

Data Collection Strategy
For each brand, unsolicited online posts and metadata were gathered across multiple digital platforms including Instagram, TikTok, X (formerly Twitter), YouTube, online news sites, forums, and blogs. This involved harvesting content containing brand-related terms, including variations in brand names (e.g., Hermes, Hermès), official social media handles (e.g., @hermes, @Hermes_Paris), and relevant hashtags (e.g., #hermes, #hermesparis, #birkinbag). The data gathering process also included three complementary approaches to ensure a holistic capture of digital consumer discourse. (see Figure 1)
-
First, keyword-based data was acquired where each brand name was used as keyword and searched across digital platform posts, comments, article content, and blog posts.
-
Second, brand account-based data is content gathered from official brand pages on major platforms, including Facebook, Instagram, and YouTube. This ensured that the data captured the brands’ own communications and interactions with audiences.
-
Third, search-based activity was captured by tracking the monthly number of Google searches for each brand. This measure provides an additional behavioral indicator of consumer interest and brand visibility in the digital environment.

Qualitative Brand Topics
An important data feature of user generated content (UGC) is its qualitative nature. In particular, the keyword-based data produces conversation posts that are qualitative in nature and follow thematic patterns. This poses a three-part problem.
-
First, UGC needs to be thematically organized.
-
Second, UGC valence (i.e. positive or negative sentiment) needs to be captured.
-
Third, the relative importance of different themes or topics is not static and is determined by the number of times the specific topic appears.
Data Processing and Cleaning
Given the immense volume of digital data, natural language processing (NLP) techniques are applied using custom-trained artificial intelligence (AI) models to classify posts by relevance, topic, and sentiment. Collecting data from open online environments introduces considerable “noise,” or irrelevant content that matches search terms but is unrelated to the studied brands. Managing this noise is essential to preserve data validity, as misleading or off-topic posts could distort analytical results and lead to inaccurate conclusions.
To address this challenge, an iterative data-cleaning process was employed. Initially, a rule-based filtering procedure was used to identify and remove patterns of irrelevant posts. Following this, a custom machine learning (ML) model was trained to enhance precision, achieving datasets comprising more than 90% relevant posts. This multi-stage process substantially improved data reliability while retaining sufficient breadth to capture the complexity of consumer conversations.
Then, machine learning models form the core of the post-labelling process, enabling automated annotation of content as new data are continuously harvested. By doing so, custom predictive models are developed to accommodate the linguistic, cultural, and product-specific nuances to identify brands, topics, and sentiment in near real-time.
To ensure scientific grounding and analytical rigor, we operationalized our data validation through a ‘Gold Standard’ hold-out methodology. Minimum performance benchmarks were established using the F1-Score, defined as: (see, Manning et al., 2008)
F1=2× Precision × Recall Precision + Recall
For sentiment and semantic tagging, a threshold of 80% F1-score was mandated. This aligns with scholarly norms in computational social science, which recognize an 80% agreement level as the benchmark for ‘near-human’ performance in automated text classification (Lombard et al., 2002; Manning & Schütze, 1999). This threshold acknowledges the ‘linguistic ceiling’—the point at which human coders themselves often disagree due to the presence of sarcasm, irony, or colloquialisms (e.g., the use of ‘sick’ as a superlative).
For brand relevance, a more stringent 90% F1-score was achieved. This was facilitated by a Support Vector Machine (SVM) classifier specifically trained to distinguish brand names from irrelevant homonyms (Lee, 2025). The use of a higher threshold for relevance ensures a ‘clean’ data foundation, which is a prerequisite for the validity of the subsequent time-series regression and digital brand equity calculations (Krippendorff, 2018). All models were validated against a manually annotated dataset of 20,000 posts to ensure the results mirrored human logic with statistical significance. Collectively, this process provides a robust foundation for constructing a valid and replicable measure of digital brand equity within the luxury domain.
UGC Themes
Utilizing the aforementioned thematic components (sentiment, semantic, relevance) associated with digital content, eight topics (listed below) are identified and chosen for analysis. For the selected topics, rather than relying solely on topic frequencies, the analysis incorporated topic sentiment calculated using a measure similar to the promotor-detractor nomenclature of the Net Promotor Score where the share of negative posts is subtracted from the share of positive posts. In concert with number of comments (volume) the addition of content valance provides depth by varying degrees of relevance and significance.
While conceptual overlap across topics is a concern to demonstrate the discriminant validity of these topics, we implemented a two-stage validation process. First, we conducted a manual audit of 20,000 posts to establish “Golden Standards” for each topic, ensuring that keywords associated with functional performance did not trigger symbolic prestige classifications. Second, our Support Vector Machine (SVM) and Topic Modeling (LDA) (Blei et al., 2003) processes achieved a minimum 80% F1-score across all eight themes, providing statistical evidence that the model can discriminate between semantically similar clusters. This high precision in classification ensures that each index component provides unique predictive value for the composite LBI score, addressing potential concerns regarding non-discrimination among thematic dimensions.
The topics retained for analysis include:
-
Style - This topic focuses on individuals discussing their clothing choices, showing their outfits, styling various pieces, and highlighting their looks featuring the product. These posts showcase how consumers incorporate the brand into their wardrobes, which builds trust and social proof, and encourages others to make similar purchases based on peer influence.
-
Recommendation - Recommendation revolves around individuals endorsing products, services, or experiences based on personal satisfaction, expertise, or perceived quality. Recommendations play a crucial role in influencing consumer behaviour and building trust in brands or offerings.
-
Influencers - This topic centres around discussions about celebrities associated with a brand, including endorsements, collaborations, and appearances at events or fashion shows. Not unlike those digital voices identified in Nicol et al. (2019).
-
Purchase Intent - Purchase Intent includes discussions that indicate a consumer’s likelihood or intention to buy a brand. It can also involve conversations about motivations, desires, or factors influencing the decision-making process, such as product features, pricing, reviews, or brand perception. This topic often reflects the consumer’s readiness to take action and is a key indicator for brands in understanding and predicting customer behaviour and potential sales.
-
Appeal - The topic of Appeal focuses on the visual attractiveness and overall design quality of a product. It involves discussions about how a product’s appearance—its colour, shape, texture, and overall style—appeals to consumers and aligns with their personal preferences. This topic highlights the importance of visual appeal in influencing consumer perceptions, emotional responses, and purchasing decisions.
-
Product Quality - Conversations on product quality include discussions about the durability, performance, craftsmanship and materials of a product. It involves evaluating how well a product meets expectations in terms of its functionality, reliability, and overall value. This topic often highlights factors such as longevity, attention to detail, and the brand’s commitment to excellence, which influence consumer trust, satisfaction, and purchasing decisions.
-
Perception of Luxuriousness - This topic includes the consumers’ view of a brand or product in terms of exclusivity, prestige, and high quality. It may involve mentions of the elements that contribute to a product’s or brand’s luxurious appeal, such as craftsmanship, premium materials, design, and price point. This topic can provide insights on how these factors influence consumer perceptions of status and desirability, as well as the role of marketing, celebrity endorsements, and cultural associations in shaping the overall image of luxury.
-
Customer Service - Customer Service as a topic covers conversations on the quality of support and assistance provided by a brand or company to its customers before, during, and after a purchase. It involves discussions about responsiveness, helpfulness, and the overall customer experience, including ease of communication, problem resolution, and the attentiveness of staff. Conversations around customer service often reflect the level of satisfaction and trust consumers have with a brand, as well as how effectively the brand meets customer needs and handles complaints or inquiries.
Developing the l247 LBI
The development of the l247 LBI employs a sequential mixed-methods approach, combining qualitative brand selection procedures with quantitative data collection and analysis. We systematically identified 20 luxury fashion brands that consistently appeared across seven independent luxury brand rankings, ensuring representation of brands with strong market visibility and perceived prestige (Keller, 2009) (see Table 1).
Raw digital data was processed using a combination of automated natural language processing and human validation. We implemented a two-stage filtering process to eliminate irrelevant content, achieving a minimum accuracy of 90% in brand relevance classification.
Measures
Multiple measures were used as input variables including (1) the Net Sentiment Score™, which is a sentiment score based on content from the eight UGC themes, (2) potential reach, (3) search volume (Google searches), and (4) three engagement metrics; likes, shares, and comments. (see Figure 1)
For relevant posts, sentiment analysis was applied (achieving at least 80% F1 Score) and topic modeling (also achieving at least 80% F1 Score) to identify eight key themes in brand-related discourse, including (1) style (Caruana et al., 2013), (2) recommendation (Pentina et al., 2018), (3) influencers (Sáenz, 2025), (4) purchase intent (Pentina et al., 2018), (5) appeal (Caruana et al., 2013), (6) product quality (Pentina et al., 2018), (7) perception of luxuriousness (Caruana et al., 2013), and (8) customer service (Pentina et al., 2018). Net Sentiment ScoreTM as a previously unpublished, trademarked metric developed by the marketing research agency l247. It is calculated by subtracting share of negative posts from share of positive posts. It is calculated based on unsolicited opinions to mirror the well-known Net Promoter Score (NPS). (Reichheld, 2003) Yet, its distinction from the Net Promotor Score metric lies in its source of unsolicited respondent feedback. Where the NPS is embedded in consumer surveys, the NSSTM draws from social sources avoiding the typical survey-based bias.
Potential reach meanwhile, refers to the total number of followers of all individuals or brands who have posted about a specific brand, i.e. all platform users that have potentially been reached with the posts about the brand (Brand24, 2025). Search volume is captured by number of Google searches (Brand24, 2025) about a brand within the time frame and engagement metrics (number of likes, shares and comments) complete the variables used to calculate brand digital value and form this index (Pentina et al., 2018).
l247 LBI Development Process
The construction of the index followed a systematic procedure to identify the most relevant variables in predicting brand value (measured by daily stock fluctuations). These weights indicate the relative predictive capability each model component has in establishing digital brand value for luxury products and form the l247 LBI.
To start the 13 variables consisting of Net Sentiment Scores (NSS) for eight UGC topics and five digital volume metrics (Search, Reach, and three Engagement types) exist on disparate scales, a multi-stage aggregation is applied. First, all raw data are standardized using Min-Max normalization to a [0, 1] range,
x′ij=(xij−mini)/(maxi−mini)
This ensures that high-volume metrics (like Search) do not mathematically overwhelm high-impact sentiment metrics.
Next, daily stock price fluctuations were used as a reference point and analyzed to identify which of the variables exhibited the strongest association with stock price movements since stock price is often a strong proxy to value. Daily stock price fluctuations were used as a reference point and analyzed to identify which of our metrics exhibited the strongest link with stock price movements. This approach recognizes stock prices as informative signals of brand value, reflecting the market’s assessment of future cash flows attributable to the brand (Barth et al., 1998; Mizik & Jacobson, 2008).
The data was analysed in periods of three days each, and the average stock price for the selected three days was used as a predictor. Every three days for six months a linear regression was independently estimated in order to determine the general importance (weights) of each feature towards the predictor (stock value). To account for the most recent weights across our time horizon having greater importance a decaying average was computed to place the most importance on recent weights and gradually less importance for earlier weights. As such, the model incorporates a decaying average time-series regression where the resulting coefficients associated with each predictive variable forms the weight or predictive ‘importance’ of each variable [eight key topics, potential reach, search volume, and engagement metrics]. Such weights are produced to maximize the index’s correlation with stock price movements over time.
As a data set that spans a long time horizon, it was analysed in periods of three-days each, and the average stock price for the selected three-days was used as a predictor. As such the modelling regression was repeated over many three-day stretches. Furthermore, given the lengthy time-horizon a decaying average approach is used so not to overweigh data in the distant past, but rather to place greater emphasis on recent digital content. To account for the most recent weights a decaying average was computed to place the most importance on recent weights and gradually less importance for earlier weights.
Finally, to make the index interpretable and comparable across brands, we used min-max scaling to normalize each variable to a [0,1] range, with the final index score calculated as a weighted sum also scaled to [0,1]. The specific weights (wi) derived from our regression analysis against stock fluctuations creating an aggregated weighted score of the input measures (xi). The final LBI for any brand is the sum of these products:
LBI=∑(x′i⋅wi)
This allows for a summated final score yet also ensures that a brand’s LBI score can be decomposed to show exactly which measures contributed most to its digital equity position.
RESULTS
The final set of features that are included in the index metric, along with their respective weights, are shown in Table 2.

These weights reflect the relative contribution of each variable—ranging from Net Sentiment Score™ across eight brand-related topics to engagement, reach, and search volume—in predicting brand value. The weighting process was empirically derived through time-series regression analysis, ensuring that each feature’s influence on brand equity is grounded in its correlation with stock price movements. This approach enhances the robustness and interpretability of the index, allowing for dynamic tracking of brand performance in digital environments.
Final ranking of the brands is presented in Table 3.

The rankings reveal how digital brand equity diverges from traditional financial metrics. Brands such as Dior and Gucci, which exhibit high levels of online engagement and cultural relevance, rank higher than heritage brands like Hermès, whose digital presence is more subdued despite strong financial performance (Luxe 2024; Vogue 2021). This suggests that digital discourse and consumer sentiment are increasingly central to brand value creation. The index thus offers a nuanced lens into luxury brand dynamics, capturing both the immediacy of consumer interactions and the evolving nature of brand prestige in the digital age.
Validation
Daily stock prices were used for the 16 brands that belong to stock exchange listed companies to provide validation of the l247 LBI. The stock prices were collected for the same period as the posts, from 29th March 2023 to 1st January 2024.
For the 4 privately held companies that do not have publicly available stock valuations, estimates were used to calculate an approximate share price. The following calculations were performed: the estimated company valuation was divided by the projected number of shares. The projected number of shares was estimated by calculating the average share count of the 16 publicly traded companies, whose shares ranged from 500 million to 1 billion. Additionally, a 7% increase in stock price was factored in, reflecting the change observed in the period from January 2023 to December 2023.
Yearly sales of the listed companies were used as an additional validation metric.

The information about sales were taken out of the brands’ official annual reports (Chanel, Hermes, Gucci, Prada, Burberry, YSL, Moncler, Bottega Veneta), revenue estimates from websites such as GrowJo (Balenciaga, Givenchy, Alexander McQueen), Zippia (Cartier, Dolce & Gabbana), Statista (Versace), LegitCheck (Dior), CPP-Luxury (Armani) or approximations made based on articles on cbo.cn (Fendi), Vogue Business (Celine), Reuters (Valentino) and LVMH official website (Louis Vuitton). It is important to note that some brands on the list belong to the same company e.g LVMH or Kering. This makes it more difficult to differentiate them based on stock price since they all have the same if they belong to the same listed company.
DISCUSSION
While prior research has largely treated brand equity as a consumer-held attitudinal construct measured through surveys, this work demonstrates how unsolicited digital discourse captures the real-time formation and diffusion of luxury brand meaning. By integrating signaling theory with consumer-based brand equity frameworks, the study explains how symbolic luxury cues—such as exclusivity, craftsmanship, and cultural relevance reinforce brand value through digital interactions.
Unlike existing brand valuation rankings or platform-specific analytics, the l247 LBI integrates thirteen grounded variables spanning organic UGC (net sentiment), engagement, search behavior, and reach. The index moves beyond descriptive social listening metrics by employing validated machine-learning thresholds and weighted aggregation, enabling consistent cross-brand comparison within and across luxury categories. Finally, the index reveals how brands with similar financial performance may exhibit markedly different digital equity profiles, highlighting the strategic importance of managing not only brand visibility but also the quality and thematic composition of digital discourse. By linking digital brand equity scores with financial performance indicators, this research demonstrates the relevance of digital signals as early indicators of brand strength, offering practitioners a complementary tool to traditional brand tracking and valuation approaches.
Collectively, these contributions position digital content not as a substitute for established brand equity measures, but as a theoretically grounded extension that captures how luxury brand value is created, communicated, and sustained in contemporary digital environments.
Our findings incorporate Berthon et al.'s (2009) model by demonstrating that functional and symbolic dimensions are not only theoretically distinct but can be statistically separated within unsolicited digital discourse. The low inter-topic correlation observed post-refinement suggests that digital luxury consumers maintain clear distinctions between a product’s “quality” (what it does) and its “luxuriousness” (what it signals), allowing for a more nuanced measurement of brand equity than traditional, often overlapping, survey-based instruments.
Specifically, the prominence of recommendation (14.5%) and purchase intent (13.7%) in our index suggests that the symbolic dimension has gained increased importance in digital contexts, where social validation becomes central to luxury brand value. These findings align with signaling theory perspectives on luxury consumption (Wiedmann et al., 2009), which emphasize the role of observable cues in conveying intangible brand attributes. The weights of recommendation and purchase intent highlight the growing role consumers play in shaping the meaning and status of luxury brands. Their discussions, endorsements and interactions generate recognisable effects on brand value. The index captures these effects and demonstrates how digital discourse has become a measurable component of luxury branding.
The l247LBI provides several key contributions to both theory and practice. Theoretically, it advances the understanding of luxury brand value by integrating consumer-based and financial perspectives through the analysis of unsolicited digital data. This approach responds to Keller & Lehmann’s (2006) call for a “brand value chain” framework that links consumer perceptions to market performance and shareholder value. The divergence between our index rankings and traditional financial metrics underscores the multidimensional nature of luxury brand value. As Kapferer and Bastien (2012) argue, luxury operates under distinct marketing principles, and our findings suggest that digital customer engagement now represents a critical dimension that complements and enhances traditional financial indicators.
PRACTICAL IMPLICATIONS
From a managerial point of view, the findings show that a significant part of luxury brand value now develops within digital culture through recommendation, visibility and symbolic association. The index offers a practical way to monitor these dynamics in real-time. This gives brand teams an early view of shifts in sentiment, emerging risks and the degree to which specific initiatives resonate with consumers. Traditional indicators tend to lag, so this approach complements existing tools by providing a more immediate perspective on brand vitality. By capturing authentic consumer sentiment across platforms and topics, the index provides insights that survey-based approaches may overlook due to social desirability bias or sampling limitations. Moreover, its ability to quantify the relative contribution of different thematic elements to overall brand sentiment enables more targeted strategic decisions in marketing communications and brand positioning.
The ranking produced by the index reveals several noteworthy patterns. A clear divergence is observed between digital brand equity and heritage-based financial performance. Brands such as Dior and Gucci, which maintain strong digital engagement, outperform heritage-focused brands like Hermès in the index, despite the latter’s superior financial metrics as supported by Vander Schee et al. (2025) who argue that argument that high levels of digital attachment (as seen in brands like Dior/Gucci) lead to the brand advocacy that drives stock price. This suggests that digital visibility and consumer discourse are increasingly influential in shaping brand equity.
Additionally, topic-specific sentiment analysis reveals that socially driven factors such as recommendation and purchase intent contribute more to brand equity than traditional attributes like product quality, challenging long-held assumptions about craftsmanship as the primary driver of luxury value. Digitally agile brands including Balenciaga, YSL, and Givenchy have successfully leveraged social media, influencer collaborations, and trend-driven campaigns to elevate their brand equity. These brands often rank higher despite lower sales volumes, highlighting the power of digital engagement in shaping consumer perceptions.
In contrast, traditional luxury houses such as Louis Vuitton, Hermès, and Chanel continue to dominate in terms of sales, benefiting from deep-rooted brand loyalty and expansive global reach, even as their digital presence remains more subdued. The index also reveals a disconnect between digital equity and sales performance. Brands like Balenciaga and Dior achieve high index scores despite comparatively modest sales figures, indicating that cultural relevance and online visibility can drive brand equity independently of immediate commercial success.
Meanwhile, niche brands such as Moncler, Fendi, and Armani demonstrate that focused market appeal does not necessarily translate into higher digital brand equity, as their specialized offerings limit broader online engagement in a rapidly evolving digital landscape. To validate the robustness of the index, its rankings were compared against market capitalization, brand sales performance, and share price data. For privately held companies lacking public stock data, estimated share prices were derived from company valuations and projected share counts. These comparisons revealed moderate correlations between the index and traditional financial metrics, indicating that the l247LBI captures dimensions of brand value that are financially relevant yet not fully reflected in conventional measures.
Further insights emerge from the top-ranked brands in the index. Dior leads in digital brand equity, driven by its strong cultural relevance, frequent collaborations, and high-profile celebrity endorsements. The brand generates substantial online conversation, particularly in fashion and beauty, though its product range does not match the breadth of global categories offered by Louis Vuitton. Louis Vuitton, while one of the highest-selling luxury brands globally, exhibits less volatility in online sentiment due to its consistent dominance, which may explain its slightly lower brand equity ranking relative to its sales performance.
Gucci, another top performer, benefits from bold, trend-setting designs and aggressive influencer marketing, which bolster its digital presence. However, its edgy image may limit appeal across more conservative market segments, tempering its overall sales despite strong brand equity. These findings reinforce the notion that brand equity and sales are shaped by distinct dynamics. Digital engagement and cultural relevance are key drivers of brand equity, while heritage, product breadth, and global demand underpin sales performance.
High brand equity, built through authentic consumer engagement and symbolic resonance, lays the foundation for long-term success by fostering loyalty, enhancing desirability, and enabling premium pricing. Brands such as Balenciaga and YSL, though not leading in sales, demonstrate strong digital visibility and consumer engagement, positioning them for future growth. Conversely, heritage brands like Hermès, despite commanding high sales, rank lower in digital brand equity due to limited online presence.
Ultimately, strong brand equity acts as a catalyst for sustained market success. Younger, trend-driven brands such as Balenciaga and Givenchy often outperform in digital brand equity, while legacy brands like Louis Vuitton, Hermès, and Cartier maintain dominance in sales through established reputations and global availability. The l247LBI thus provides a nuanced and timely framework for understanding the evolving interplay between digital engagement and traditional brand metrics in the luxury sector.
CONCLUSION, LIMITATIONS & FUTURE RESEARCH
The development of the l247Luxury Brand Index represents a meaningful step forward in the measurement of luxury brand value in the digital age. By harnessing unsolicited consumer discourse across digital platforms, the index offers a dynamic and scalable alternative to traditional survey-based or financial metrics. It captures the immediacy of consumer sentiment, the reach of brand-related conversations, and the engagement levels that reflect cultural relevance and symbolic value. The findings underscore a growing divergence between digital brand equity and heritage-based brand prestige, revealing how consumer-driven narratives increasingly shape brand performance and perception. This approach not only enhances academic understanding of brand dynamics but also equips practitioners with a real-time tool for strategic brand management in a hyperconnected marketplace.
While this research achieves its intended goal, several limitations exist along with opportunities to develop further research opportunities. First, the study’s linguistic scope is confined to English-language content, which may obscure important cultural nuances in markets where luxury consumption follows different patterns. The analysis draws on English-language content, which provides consistency for this version of the index but does not reflect sentiment dynamics in all luxury markets. The approach, however, can be extended to additional languages in future work. This is particularly relevant in regions such as China, Japan, and the Middle East, where digital behaviors and brand associations are shaped by distinct cultural frameworks. Future research should incorporate multilingual data and culturally adaptive sentiment models to improve global applicability and analytical depth.
Second, while the index demonstrates moderate correlation with financial metrics such as stock prices and sales, it does not establish causality. The relationship between digital sentiment and financial outcomes is complex and likely mediated by various factors, including marketing activities, macroeconomic conditions, and consumer trends. Establishing causal links would require longitudinal studies that track brand equity and financial performance over extended periods, ideally with time-lagged modeling to account for delayed effects.
Third, the current analysis focuses primarily on fashion and accessories brands, which, while central to the luxury sector, represent only a subset of the broader luxury landscape. Categories such as luxury automobiles, hospitality, fine art, and high-end services may exhibit different patterns of digital engagement and consumer discourse. Extending the index to these sectors would provide a more comprehensive understanding of luxury brand equity across diverse domains.
Additionally, the reliance on major social platforms introduces potential bias toward younger, digitally active audiences. While this demographic is increasingly influential, it may not fully represent the broader luxury consumer base. Moreover, despite the use of machine learning models to clean and classify data, the risk of misclassification or sentiment distortion remains. Refining natural language processing techniques and incorporating platform-specific dynamics could enhance the precision and reliability of future analyses.
Another notable limitation of the current index is the fixed nature of the eight semantic topics. As the luxury landscape evolves, emerging themes such as Sustainability and ESG (Environmental, Social, and Governance) are becoming central to consumer discourse. Future iterations of the l247 LBI could incorporate a ‘Sustainability’ topic.
Furthermore, while we utilized objective market signals—namely stock prices and sales data—for validation, future research could benefit from comparing digital equity scores with established survey-based benchmarks like the American Customer Satisfaction Index (ACSI). Theoretically, we expect that while the LBI reflects high-frequency shifts in cultural relevance and desire, testing indices like the ACSI may enhance the depth of the index. Perhaps exploring differences between unsolicited digital sentiment and solicited survey results could provide deeper insight into the ‘authenticity gap’ in luxury branding.
Finally, the use of estimated share prices for privately held companies introduces a degree of uncertainty in the validation process. While necessary for comparative purposes, these approximations may not accurately reflect true market valuations. Future studies could benefit from triangulating multiple valuation sources or collaborating with industry analysts to improve accuracy.
As luxury brands navigate increasingly integrated physical and digital environments, the ability to interpret consumer-driven discourse at scale will become central to how brand equity is assessed and developed. Looking ahead, several promising avenues for future research emerge. Scholars could explore how cultural context shapes digital luxury discourse across languages and regions, developing sentiment models that reflect local values and expressions. Longitudinal studies could investigate how shifts in digital brand equity predict long-term financial outcomes, brand resilience, and consumer loyalty. The methodology could also be applied to other luxury sectors, revealing sector-specific drivers of brand value. Further research might examine the role of influencers and user-generated content in shaping brand narratives, or integrate environmental, social, and governance (ESG) metrics to assess how ethical and sustainable practices influence digital brand equity. Finally, the index could be tested as a predictive tool for brand crises, evaluating its ability to detect reputational risks in real-time and guide responsive brand strategies.
In sum, while the l247LBI is not without limitations, it offers a robust and innovative framework for understanding luxury brand value in the digital era. By bridging the gap between consumer sentiment and financial performance, it contributes meaningfully to both academic theory and managerial practice, and lays the groundwork for future research in a rapidly evolving branding landscape.
Acknowledgement
The authors acknowledge the support of Glion Institute of Higher Education (GIHE) during the development of this manuscript.