
1. Introduction
Artificial intelligence (AI) has become a defining feature of contemporary digital marketing. Organizations increasingly rely on AI-driven systems to personalize advertising, recommend products, automate customer service interactions, and predict consumer preferences at scale (Davenport et al., 2020). These capabilities allow marketers to process behavioral data with a level of precision that was previously unattainable.
Despite these advances, the growing presence of AI in marketing has generated significant consumer anxiety regarding privacy, transparency, and ethical data use. Consumers are increasingly aware that AI systems collect and analyze personal information to influence purchasing behavior, often through processes that are unclear and difficult to evaluate. Trust, defined as the expectation that exchange partners will act reliably and benevolently, has emerged as a central variable in understanding consumer responses to AI-powered marketing (Morgan & Hunt, 1994).
In AI-mediated marketing environments, trust is not limited to organizational credibility. Consumers must also evaluate the reliability and fairness of algorithmic systems that operate invisibly behind personalization interfaces (Marthews & Tucker, 2019). This opacity creates a fundamental tension: personalization systems designed to improve marketing relevance may simultaneously generate perceptions of surveillance and manipulation, thereby undermining the trust required for long-term consumer relationships.
The present study makes a focused empirical contribution by documenting what we term the AI trust gap: the disconnect between consumers who accept AI marketing as functionally useful but remain skeptical of the organizations deploying it. Prior research has examined privacy concerns, algorithm aversion, and trust in automation separately; this study brings them together in a single marketing context to show how these forces combine to produce cautious rather than trusting consumer postures toward AI-powered marketing. The study uses statistical comparisons to identify whether consumer trust attitudes lean positive or negative, whether AI adoption changes perceptions of companies across specific dimensions, and how key attitudes relate to one another. Rather than testing a fully specified causal model, the study aims to characterize the trust landscape and generate hypotheses for future research.
The study addresses the following research questions:
RQ1: Do consumer trust attitudes toward AI-powered marketing lean more positive or negative?
RQ2: Does AI adoption influence perceptions of companies?
RQ3: How are key consumer attitudes toward AI-powered marketing related to one another?
RQ4: What broader patterns can be used to characterize the overall AI trust landscape?
2. Literature Review
The following review draws on four streams of relevant theory and research. Rather than presenting these as parallel frameworks, we integrate them around a central question: why might consumers accept AI marketing as useful while remaining skeptical of the organizations using it? Privacy calculus theory explains the cost-benefit logic governing data sharing. The personalization paradox and creepy marketing research show how data-driven personalization can backfire. Trust-in-automation theory explains how familiarity with technology builds confidence over time. Commitment-Trust Theory grounds the organizational trust dimension. Together, these perspectives set up the AI trust gap this study investigates.
2.1. Consumer Trust and Commitment-Trust Theory
Morgan and Hunt’s (1994) Commitment-Trust Theory identifies trust as central to cooperative exchange, arguing that parties who trust one another are more likely to commit to long-term relationships and less likely to engage in opportunistic behavior. In digital environments, where consumers cannot directly observe organizational practices, trust plays an especially critical role in reducing perceived risk and sustaining engagement.
In AI-enabled marketing contexts, trust extends beyond the organization itself to encompass confidence in the technological systems generating recommendations and automating interactions. Consumers must develop trust in AI systems they cannot inspect, making transparency and perceived benevolence especially consequential (Murtarelli et al., 2021). Perceived trustworthiness predicts consumer willingness to engage with personalized services and share personal information (Kim & Park, 2013).
Trust has also been shown to shape important marketplace outcomes beyond attitudes and behavioral intentions. Chaudhuri and Ligas (2016) found that trust, rather than satisfaction, was the mechanism through which favorable perceptions of merchandise value translated into consumers’ willingness to pay premium prices. Their findings position trust as a relational pathway connecting positive evaluations of a firm to concrete economic behavior. Extending this logic to AI-powered marketing, trust may similarly determine whether favorable perceptions of AI-driven personalization translate into deeper consumer engagement and sustained relationships.
2.2. Trust in Automation and Artificial Intelligence
Trust in AI can be understood as a specialized form of trust in automated systems more broadly. Hoff and Bashir (2015) propose that trust in automation develops through the interaction of dispositional tendencies, situational context, and accumulated experience with the technology itself. Their framework suggests that people evaluate automated systems not only according to objective performance but also according to perceived reliability, predictability, transparency, and the degree of control retained by the user. Because consumers rarely observe the algorithms responsible for personalization and recommendation directly, trust becomes an especially important mechanism for managing the uncertainty inherent in these interactions.
A broad review of the AI trust literature by Glikson and Woolley (2020) identifies trust as one of the most consistent predictors of AI acceptance across contexts. Their synthesis finds that trust in AI is shaped by perceived fairness, explainability, competence, and accountability, while concerns about bias, privacy intrusion, and insufficient transparency tend to erode it. Together, these findings suggest that consumer trust in AI-powered marketing depends not only on technological performance but also on broader perceptions of how, and for what purpose, AI systems are deployed.
2.3. Privacy Calculus and Data-Sharing Behavior
Privacy calculus theory proposes that individuals weigh potential benefits against privacy risks when deciding whether to disclose personal information (Dinev & Hart, 2006). In AI-driven personalization contexts, this calculus is especially salient: personalized marketing may improve relevance and convenience, but it depends on data collection practices that many consumers experience as intrusive or threatening.
This tension has been described in the marketing literature as the personalization paradox. Aguirre et al. (2015) found that while consumers value the relevance and convenience that personalization provides, they simultaneously grow uncomfortable when firms appear to know an excessive amount about them. Their findings indicate that personalization tends to strengthen consumer experience when data practices are transparent and expected, but undermines trust when consumers perceive the underlying data collection as surveillance rather than service.
Related concerns have been explored through the concept of creepy marketing. Moore et al. (2015) argue that consumers label marketing practices as creepy when firms use personal information in ways that exceed what consumers consider socially normative. Their qualitative work identifies three underlying dimensions of this reaction: a sense of privacy invasion, stalking-like surveillance, and violations of broader social norms. These dimensions are particularly relevant to AI-driven marketing, where sophisticated personalization systems can easily create the impression that a firm knows too much, even when no rule has technically been broken.
The benefit-risk tradeoff is context-sensitive and individual-specific (Awad & Krishnan, 2006). Concerns about data misuse, algorithmic opacity, and lack of consumer control have been shown to reduce willingness to disclose personal information even when material benefits are offered (Martin et al., 2017).
2.4. AI-Specific Trust Challenges
Algorithm aversion, the tendency to reject algorithmic recommendations even when they outperform human judgment, is well documented in the behavioral literature (Dietvorst et al., 2015). In marketing and decision-making contexts, algorithm aversion may manifest as skepticism toward AI-generated recommendations, resistance to personalization systems, or general wariness of AI-powered interactions regardless of their functional quality (Jussupow et al., 2024; Liu et al., 2023; Yalcin et al., 2022).
Transparency has emerged as a key factor shaping AI trust. Puntoni et al. (2021) show that consumers approach AI interactions through an experiential lens, evaluating not only outcomes but the process through which AI arrives at them. Opaque machine-learning systems that cannot explain their recommendations create a transparency gap that undermines confidence even when outcomes are satisfactory. This transparency gap motivates the present investigation.
While neither Banerjee et al. (2025) nor Dang et al. (2025) directly examined AI-powered marketing, their findings offer conceptual extensions relevant to this context. Banerjee et al. (2025) found that perceived authenticity shapes consumer engagement with social media influencer content, and Dang et al. (2025) found that trending content elements in short-form advertisements generated greater engagement than content without such features. By extension — and not as a direct finding of those studies — these results suggest that consumers may similarly evaluate AI-generated marketing content not only on informational value but also on perceived authenticity and fit with platform-specific communication norms.
3. Methodology
3.1. Research Design and Orientation
This study employed a quantitative, cross-sectional survey design to examine consumer attitudes toward AI-powered digital marketing. Consistent with the objectives of exploratory research, the study seeks to identify directional patterns and relationships that may inform future theory development rather than test a fully specified causal model (Stebbins, 2001). Because cross-sectional survey designs provide limited evidence regarding temporal ordering and causality, the findings should be interpreted as hypothesis-generating rather than confirmatory (Rindfleisch et al., 2008).
3.2. Sample and Data Collection
Data were collected through a nationally distributed online consumer panel administered by Qualtrics. The final analytical sample consisted of 500 U.S. adult consumers who completed the full survey (N = 553 initiated; 53 excluded for incomplete responses). All respondents confirmed familiarity with digital marketing and awareness of AI prior to entering the main survey. An English-language fluency check required participants to compose a written description of a product displayed on screen; respondents who failed were excluded. Demographic composition: gender was approximately equal (48.6% male, 51.4% female); age ranged across all adult cohorts with the largest segment aged 55–64 (23.0%); racial composition was 64.8% Caucasian, 13.4% African American, 8.8% Hispanic, and 6.8% Asian; the majority held at least a college degree.
One limitation of the survey design is that respondents were asked about ‘AI-powered digital marketing’ generally, rather than a specific AI application. Different respondents may have had different AI applications in mind when answering, which introduces heterogeneity in the referent and should be considered when interpreting the findings.
3.3. Measures
The survey instrument was developed based on constructs from the consumer trust and AI acceptance literatures. Items were adapted from previously validated scales where available; study-specific items were developed for constructs without established measures. All Likert-scale items used a 7-point format (1 = Strongly Disagree to 7 = Strongly Agree). Table 1 summarizes the constructs, sample items, item counts, scale sources, and reliability coefficients. A complete listing of all survey items is provided in Appendix A.
3.4. Data Preparation
Prior to analysis, a data quality check identified a coding error in the individual trust items (Q2): the data export had recorded a value of 9 in place of the intended value of 7 (Strongly Agree). This was identified by examining the range of values against the documented 1–7 scale and confirmed via the value label mapping in the SPSS export file. All instances were corrected prior to analysis. No other variables showed irregularities.
3.5. Reliability
Internal consistency reliability was assessed using Cronbach’s alpha for multi-item scales and Spearman-Brown coefficients for two-item measures. The AI Digital Marketing Attitude scale demonstrated good reliability (α = .855), while the General Company Trust (α = .870) and AI Company Trust (α = .894) scales demonstrated strong reliability. The Individual Trust measure exhibited lower internal consistency (α = .688), consistent with reviewers’ observation that the four items (self-trustworthiness, interpersonal trust, personal ethics, and trust in AI) may capture related but conceptually distinct dimensions. Accordingly, these items are analyzed and interpreted individually rather than as a composite. For the two-item measures, AI Trust Impact demonstrated excellent reliability (Spearman-Brown = .933) and Data Sharing Willingness also demonstrated excellent reliability (Spearman-Brown = .953).
3.6. Analytical Approach
Analyses were conducted in Python using the SciPy and Statsmodels libraries. One-sample t-tests compared each construct’s average against the scale midpoint of 4.0 (addressing RQ1). Paired-samples t-tests compared how the same respondents rated general companies versus AI-using companies across seven trust dimensions, with Bonferroni correction applied for multiple comparisons (addressing RQ2). Cohen’s d and 95% confidence intervals are reported alongside significance tests to communicate practical effect magnitude. Pearson correlations and a multiple linear regression model, including variance inflation factor (VIF) diagnostics to assess multicollinearity, examined attitudinal interrelationships and predictors of AI company trust (addressing RQ3). One-way ANOVAs with Tukey HSD post hoc tests examined whether trust differed across subgroups defined by AI usage frequency, age, and gender, alongside descriptive privacy analyses (addressing RQ4). Common method bias was assessed via Harman’s single-factor test applied to the set of primary perceptual variables.
4. Results
4.1. Research Question 1: Do Consumer Trust Attitudes Toward AI-Powered Marketing Lean More Positive or Negative?
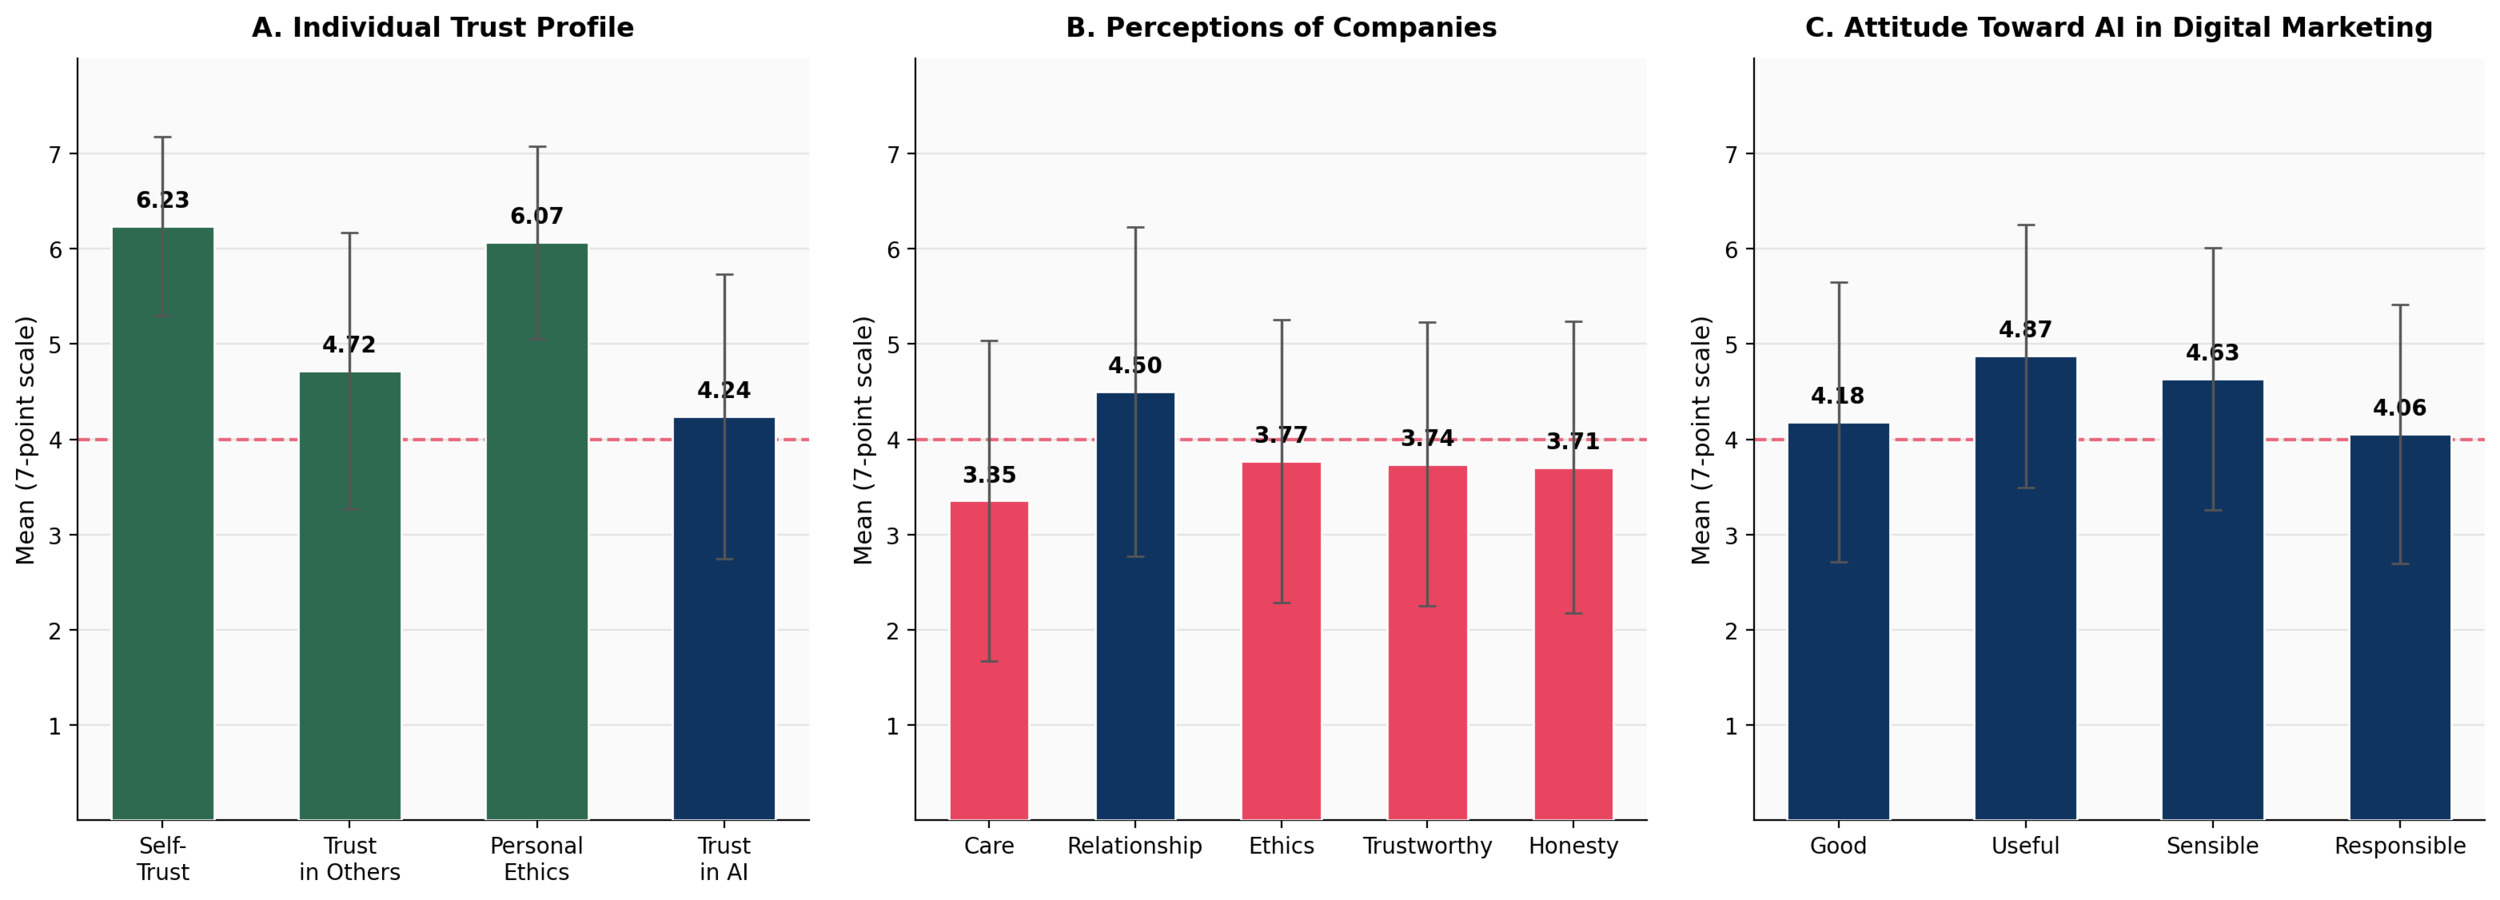
To address RQ1, one-sample t-tests compared respondents’ average ratings against the scale midpoint of 4.0. Table 2 and Figure 1 present the results.
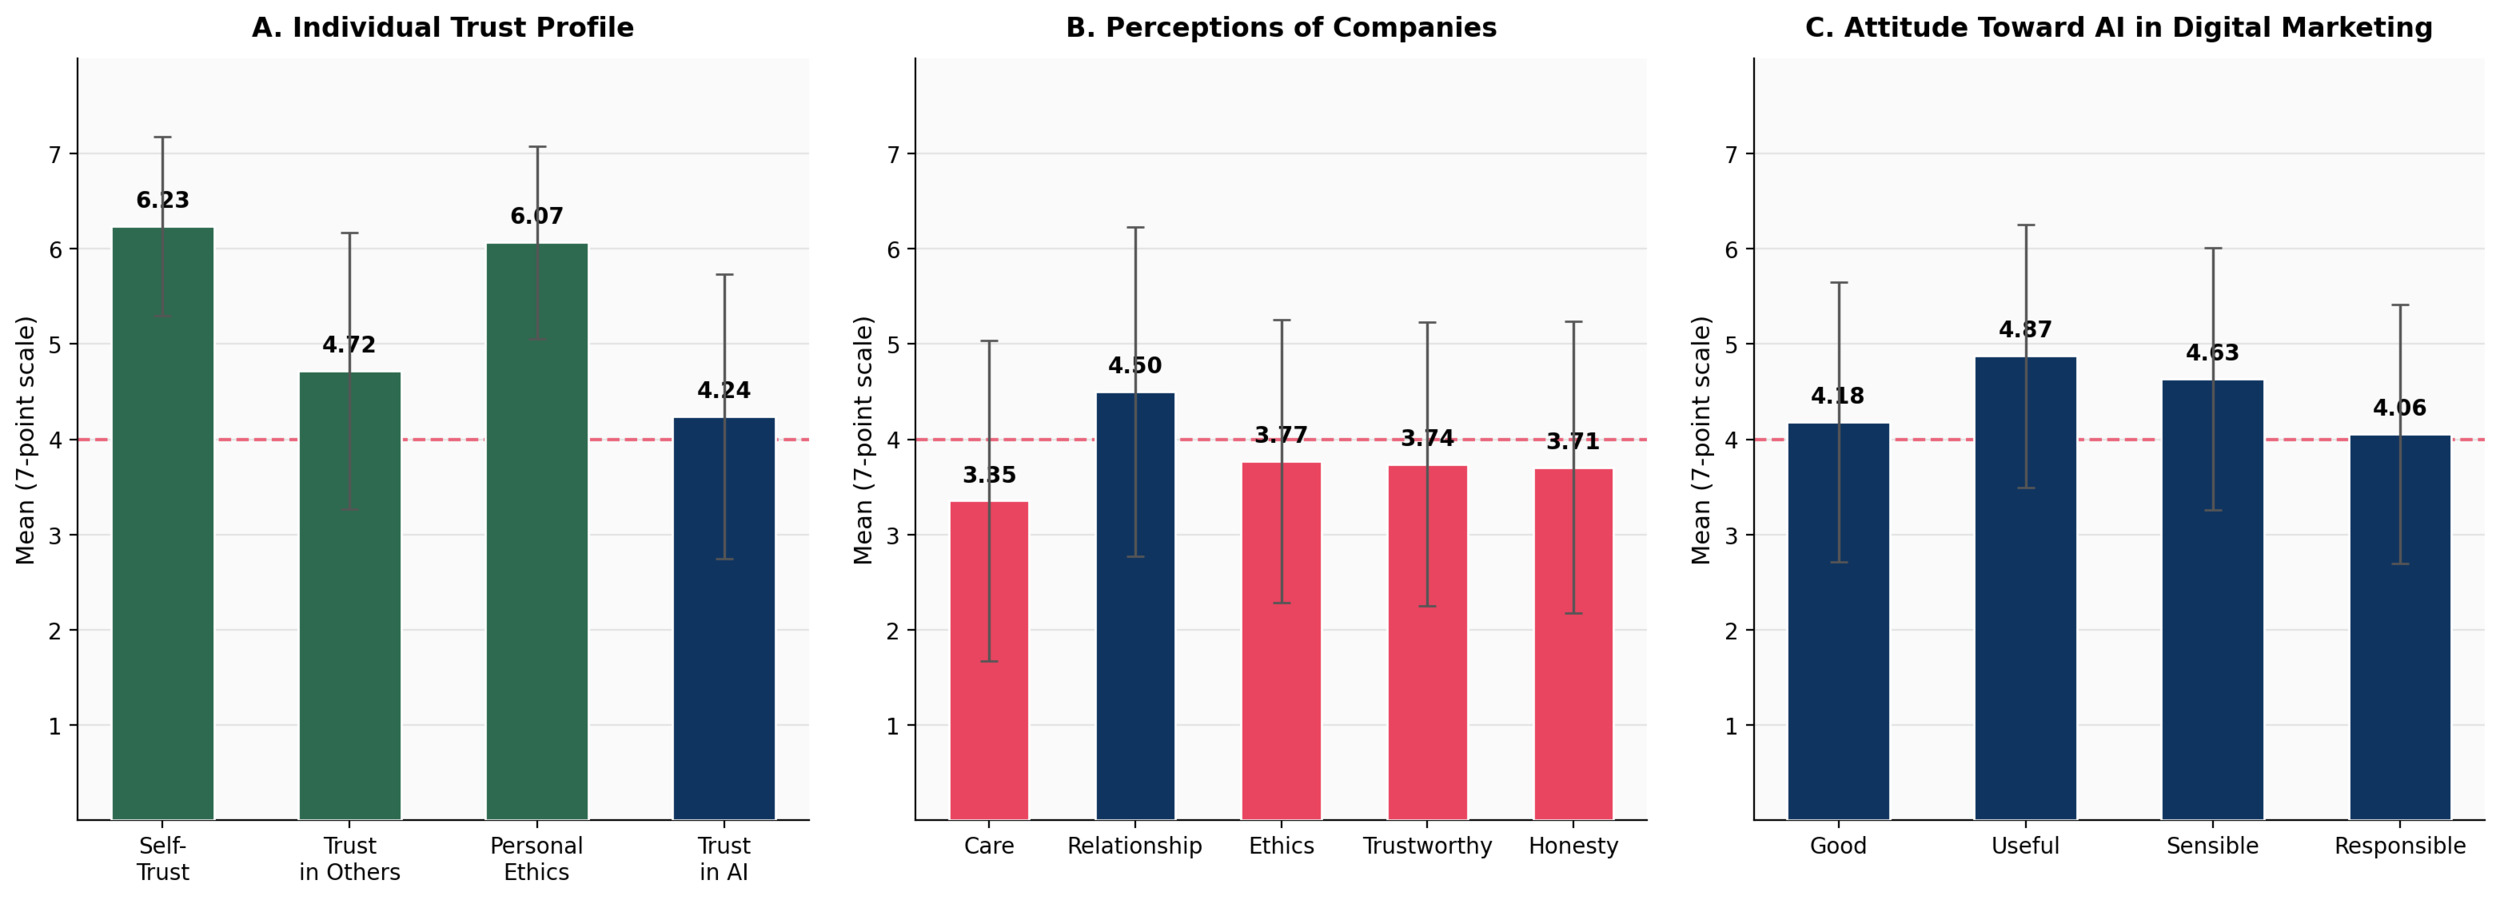
Consumers reported high self-trustworthiness (M = 6.23, SD = 0.94) and personal ethics (M = 6.07, SD = 1.01), both significantly above the midpoint (p < .001). Trust in others was also above neutral (M = 4.72, SD = 1.45, p < .001). Trust in AI was above the midpoint (M = 4.24, SD = 1.49, p = .001), though only modestly so, suggesting cautious rather than confident trust.
Attitudes toward AI in digital marketing were generally favorable. Respondents rated AI DM as useful (M = 4.87, p < .001) and sensible (M = 4.63, p < .001), while perceptions that AI DM is responsible did not differ significantly from neutral (M = 4.06, p = .358). This pattern suggests consumers recognize practical benefits of AI marketing while remaining uncertain about its ethical deployment.
In contrast, several outcome measures were significantly below neutral. Respondents disagreed that AI-using companies act in their best interests (M = 3.26, SD = 1.60, p < .001), and reported that both AI use generally (M = 3.66) and personalized AI marketing specifically (M = 3.62) decrease rather than increase trust. Willingness to share data for benefits was also below neutral (M = 3.40 and M = 3.33). Taken together, these findings suggest that consumer trust toward AI-powered marketing is best characterized as cautious and conditional. Consumers accept AI’s functional utility while remaining skeptical about the organizations deploying it — precisely the AI trust gap this study investigates.
4.2. Research Question 2: Does AI Adoption Influence Perceptions of Companies?
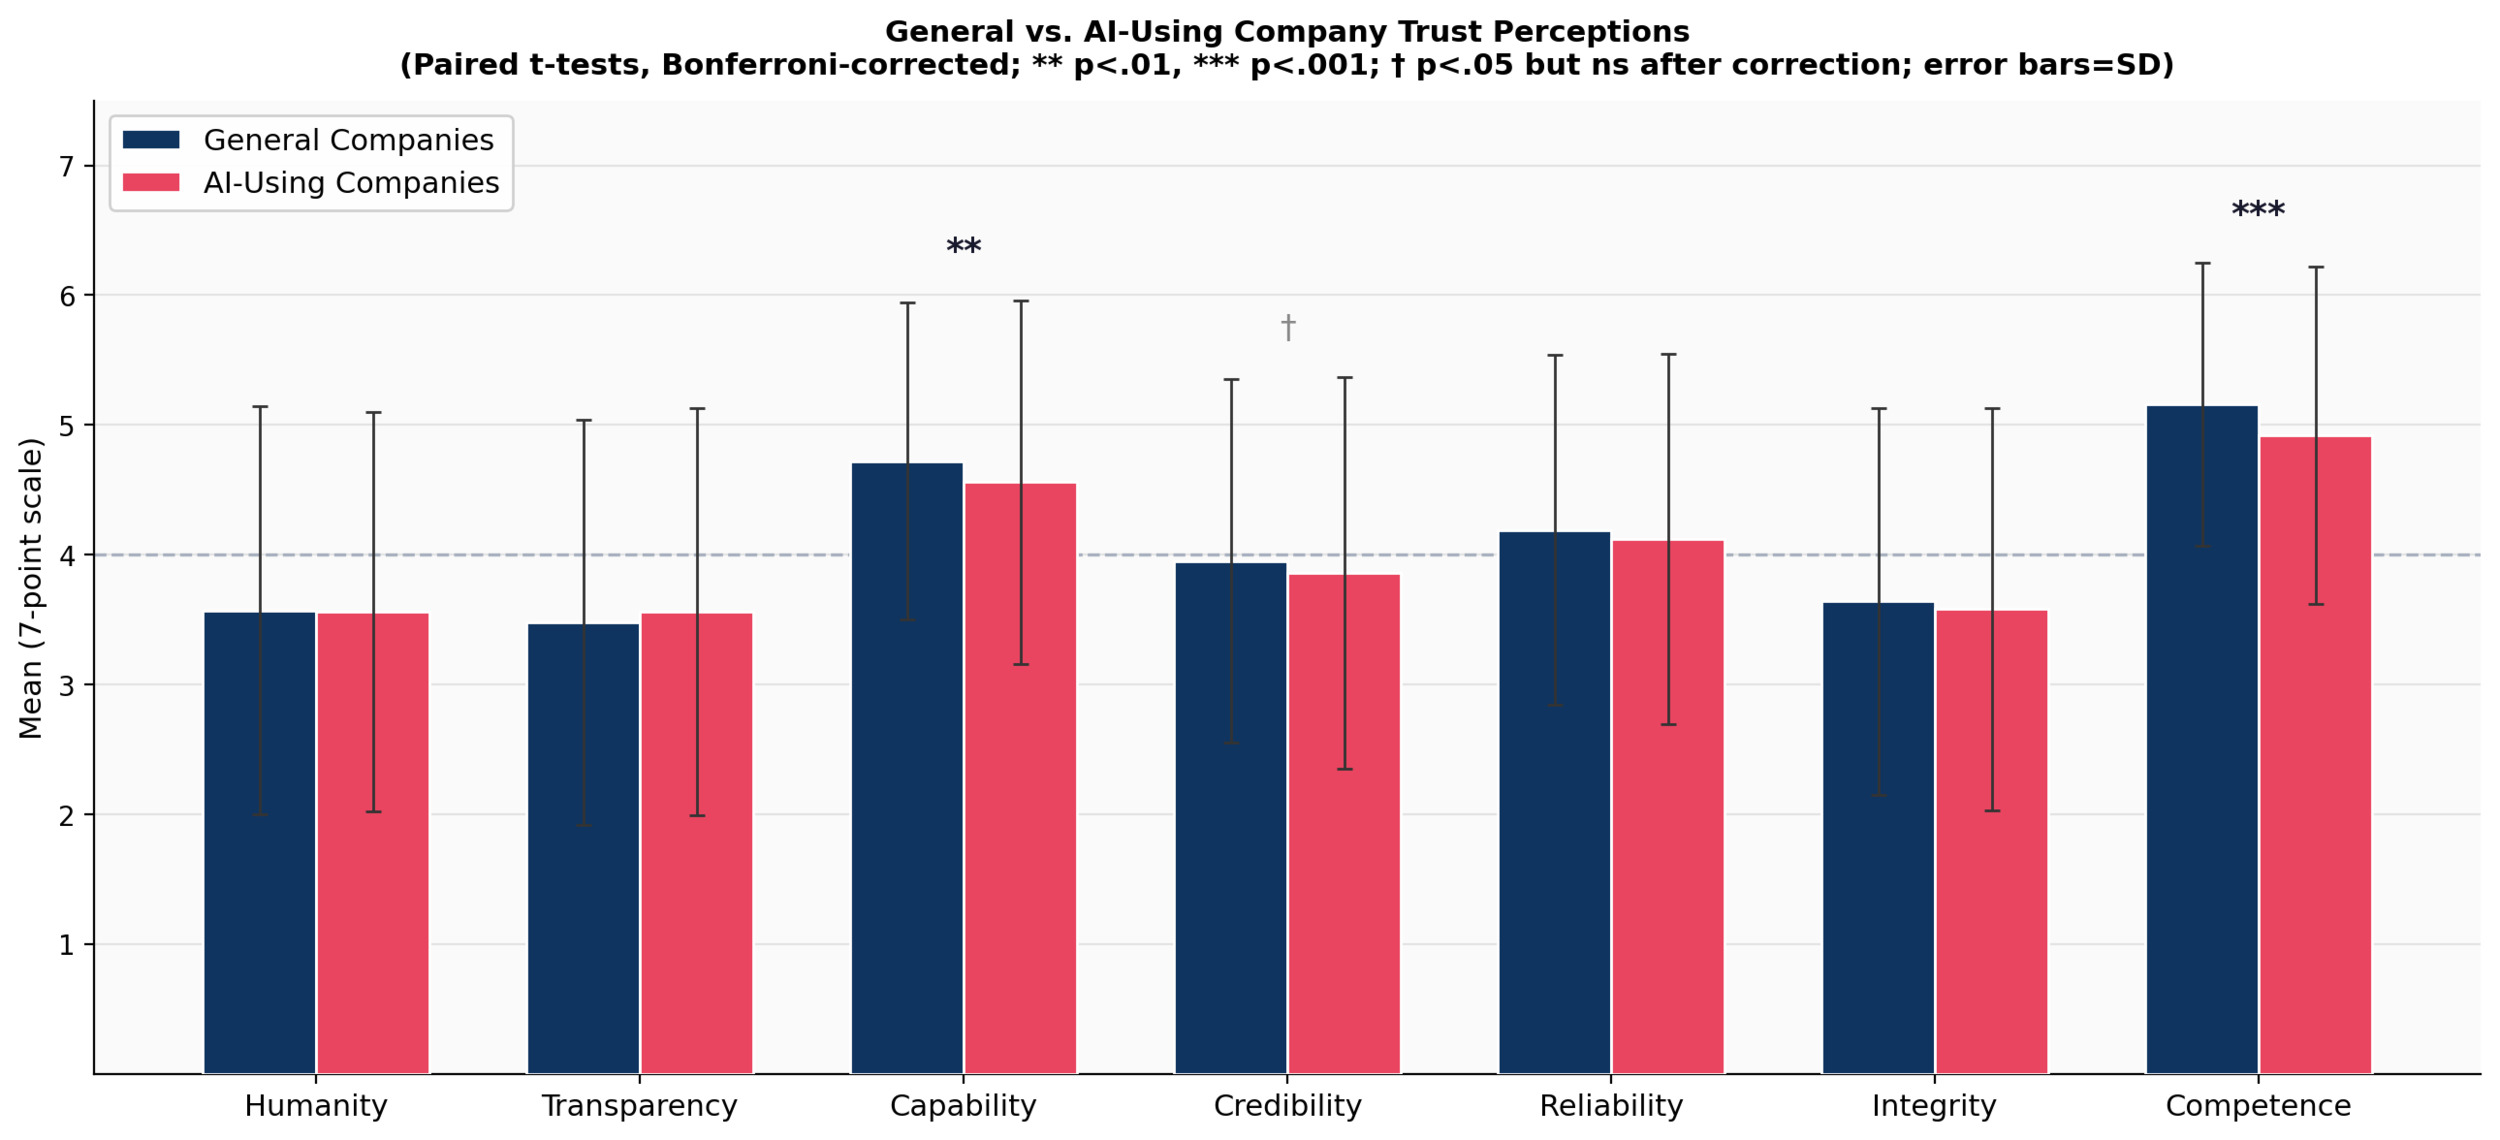
To address RQ2, paired-samples t-tests compared how the same 500 respondents rated general companies versus AI-using companies across seven trust dimensions. Bonferroni correction was applied given the seven simultaneous comparisons (corrected α = .007). Table 3 and Figure 2 present the results, including effect sizes (Cohen’s d) and 95% confidence intervals.
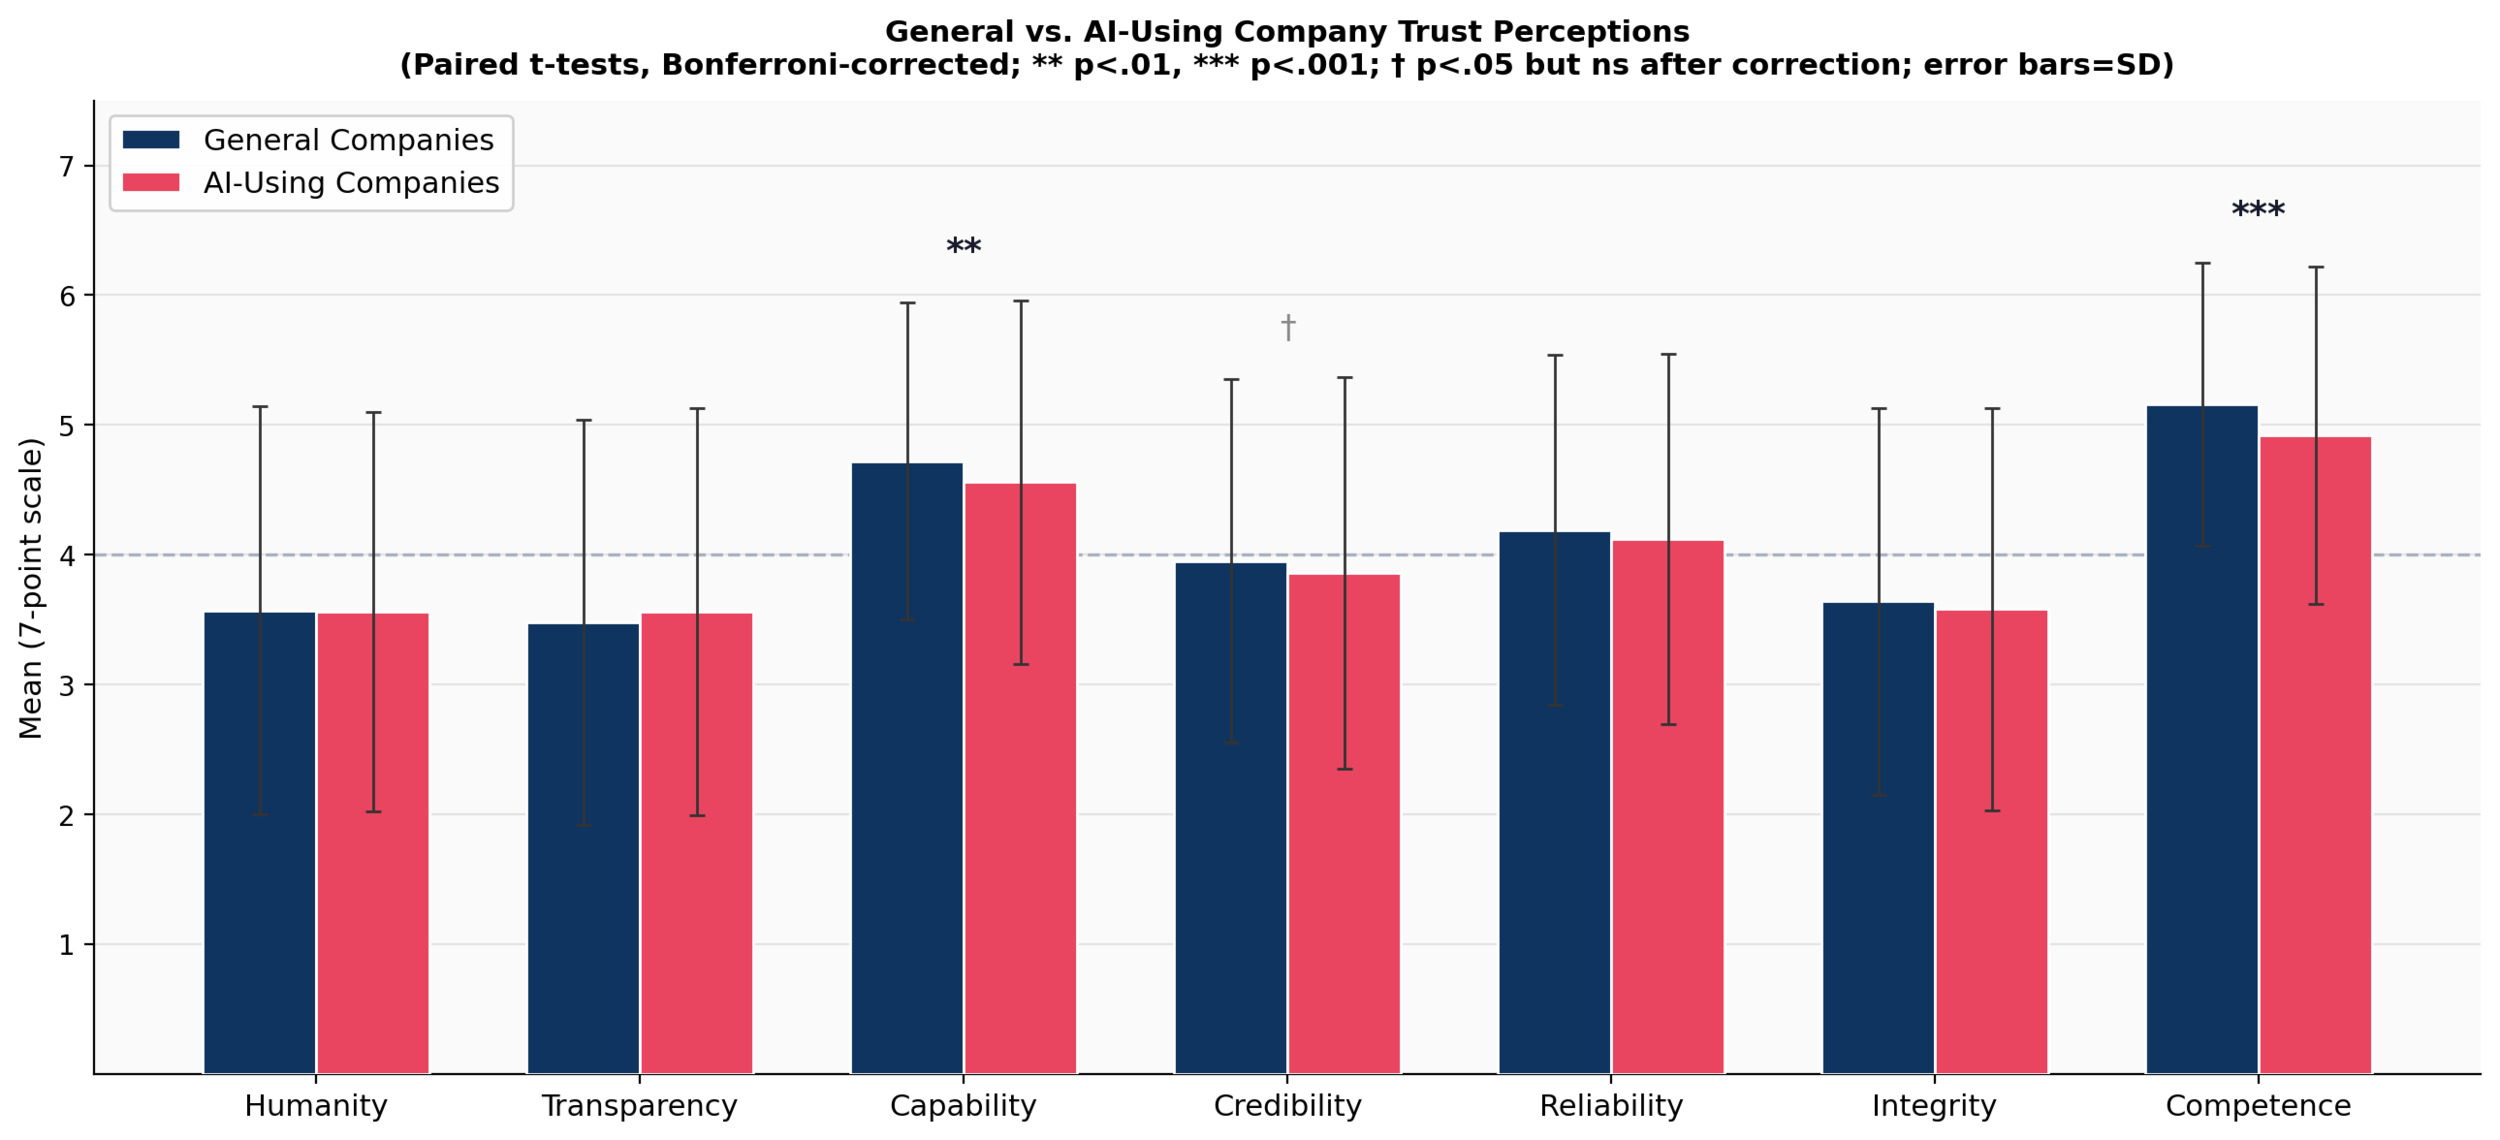
After Bonferroni correction, two dimensions showed statistically significant differences. Competence was rated meaningfully lower for AI-using companies (M = 4.92) than for companies generally (M = 5.16), t(499) = 5.03, p < .001, d = 0.225, 95% CI [0.144, 0.328]. Capability also differed significantly (General M = 4.72; AI M = 4.56), t(499) = 3.24, p = .001, d = 0.145, 95% CI [0.062, 0.250]. Credibility (p = .049) did not survive Bonferroni correction and should be interpreted with caution.
No significant differences after correction emerged on human-centered dimensions: Humanity (p = .887), Transparency (p = .113), Integrity (p = .129), and Reliability (p = .110). These effect sizes are small in magnitude (d < 0.20 for all non-significant dimensions), and it is important to note that non-significant results do not establish equivalence between the two conditions. Rather, the data do not provide sufficient evidence to conclude these perceptions differ.
The observed pattern suggests a selective competence-related penalty associated with AI adoption: companies using AI are perceived as less capable and less competent than companies generally, but there is no significant evidence of differences on ethical or relational dimensions. RQ2 is answered: AI adoption is associated with selectively lower perceptions of competence-related trust dimensions, rather than a broad or uniform erosion of trust.
4.3. Research Question 3: How Are Key Consumer Attitudes Related to One Another?
To address RQ3, Pearson correlations characterized relationships among key constructs, and a multiple regression identified the strongest attitudinal predictors of AI company trust. Table 4 presents correlations and Table 5 presents regression results.
All relationships were positive and significant at p < .001. The strongest was between General Company Trust and AI Company Trust (r = .874), indicating that pre-existing corporate trust attitudes carry strongly into AI-specific contexts. Attitude toward AI DM was also strongly related to AI company trust (r = .720). Harman’s single-factor test indicated that the first unrotated factor explained 65.8% of total variance, which exceeds the 50% threshold used as a heuristic for potential common method bias. This result does not necessarily invalidate the findings but warrants caution when interpreting the magnitude of shared relationships, and is acknowledged as a limitation of the single-source survey design.
The overall model was significant and explained substantial variance, R2 = .645, F(5, 490) = 177.76, p < .001. VIF scores ranged from 1.38 to 2.76, all well below the conventional concern threshold of 10 (or conservative threshold of 5), indicating acceptable multicollinearity. Attitude toward AI DM (B = .334, p < .001) and belief that AI acts in consumers’ best interests (B = .283, p < .001) were the strongest predictors. Perceived trust impact of AI also contributed significantly (B = .134, p = .002). General trust in AI (p = .081) and data-sharing willingness (p = .774) were not significant once other variables were controlled. It is important to note that the predictor ‘AI increases trust’ and the outcome ‘AI company trust’ are conceptually related, and this overlap may contribute to the predictive strength of the model. The findings should be interpreted as associative rather than causal, and the regression is best understood as characterizing which attitudes are most closely interrelated.
4.4. Research Question 4: What Broader Patterns Characterize the AI Trust Landscape?
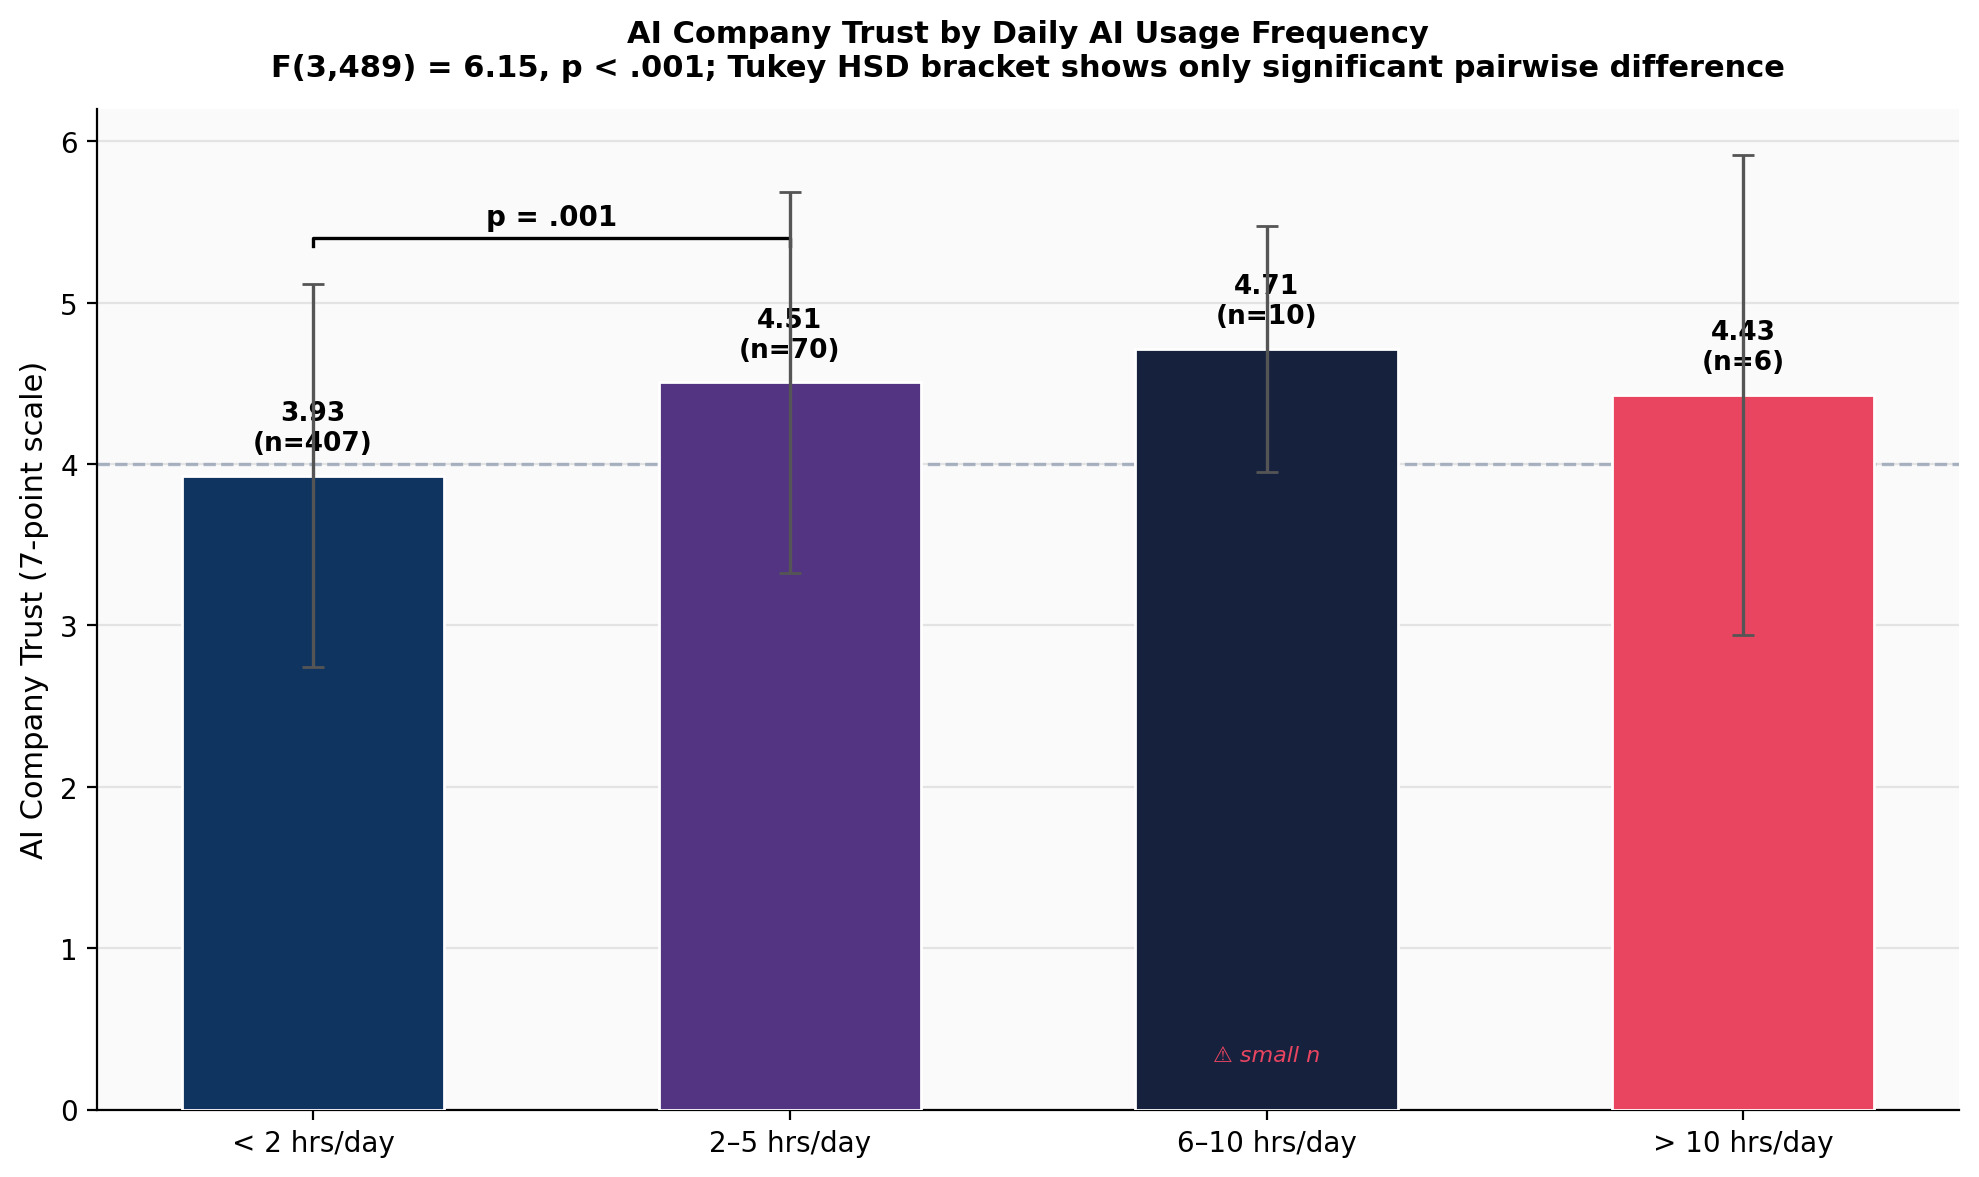
To address RQ4, one-way ANOVAs with Tukey HSD post hoc tests examined whether AI company trust differed across consumer subgroups, and descriptive analyses characterized privacy concerns and trust-building preferences. Table 6 and Figure 3 present the group-comparison results.
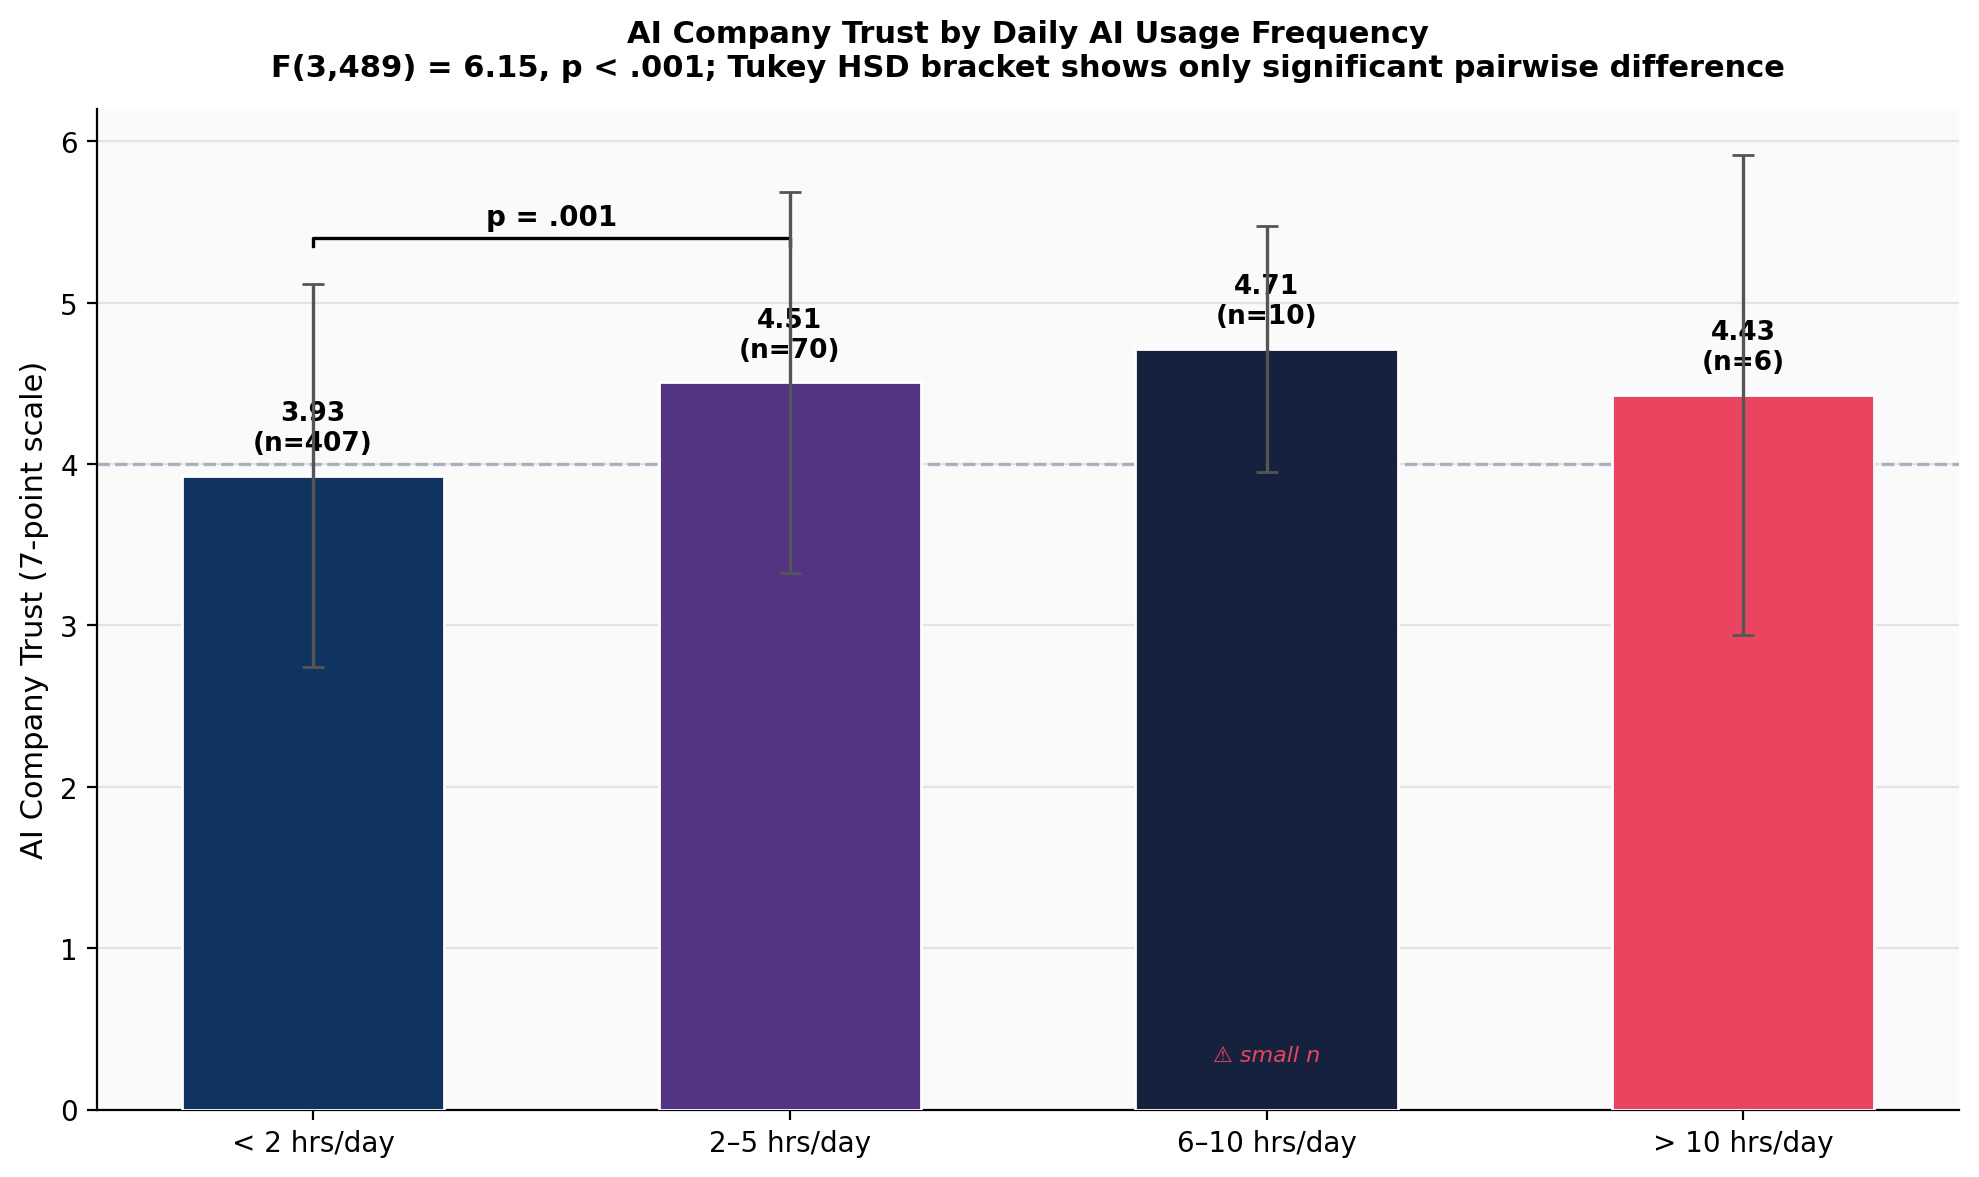
The overall ANOVA for daily AI usage was significant, F(3, 489) = 6.15, p < .001. Tukey HSD post hoc tests revealed that only the difference between the less-than-2-hours group (M = 3.93, n = 407) and the 2-to-5-hours group (M = 4.51, n = 70) was statistically significant (p = .001). No other group comparisons reached significance, including those involving the 6-to-10-hours (n = 10) and greater-than-10-hours (n = 6) groups. Given the extremely small sample sizes in these latter two groups, conclusions about their means should not be drawn, and future research should examine high-usage consumers with an appropriately powered design.
Age group, F(5, 494) = 1.48, p = .196, and gender, t(498) = 0.96, p = .340, were not significantly associated with AI company trust. These results should not be interpreted as establishing that age and gender are unrelated to trust; rather, this study did not find sufficient evidence of a relationship in this sample.
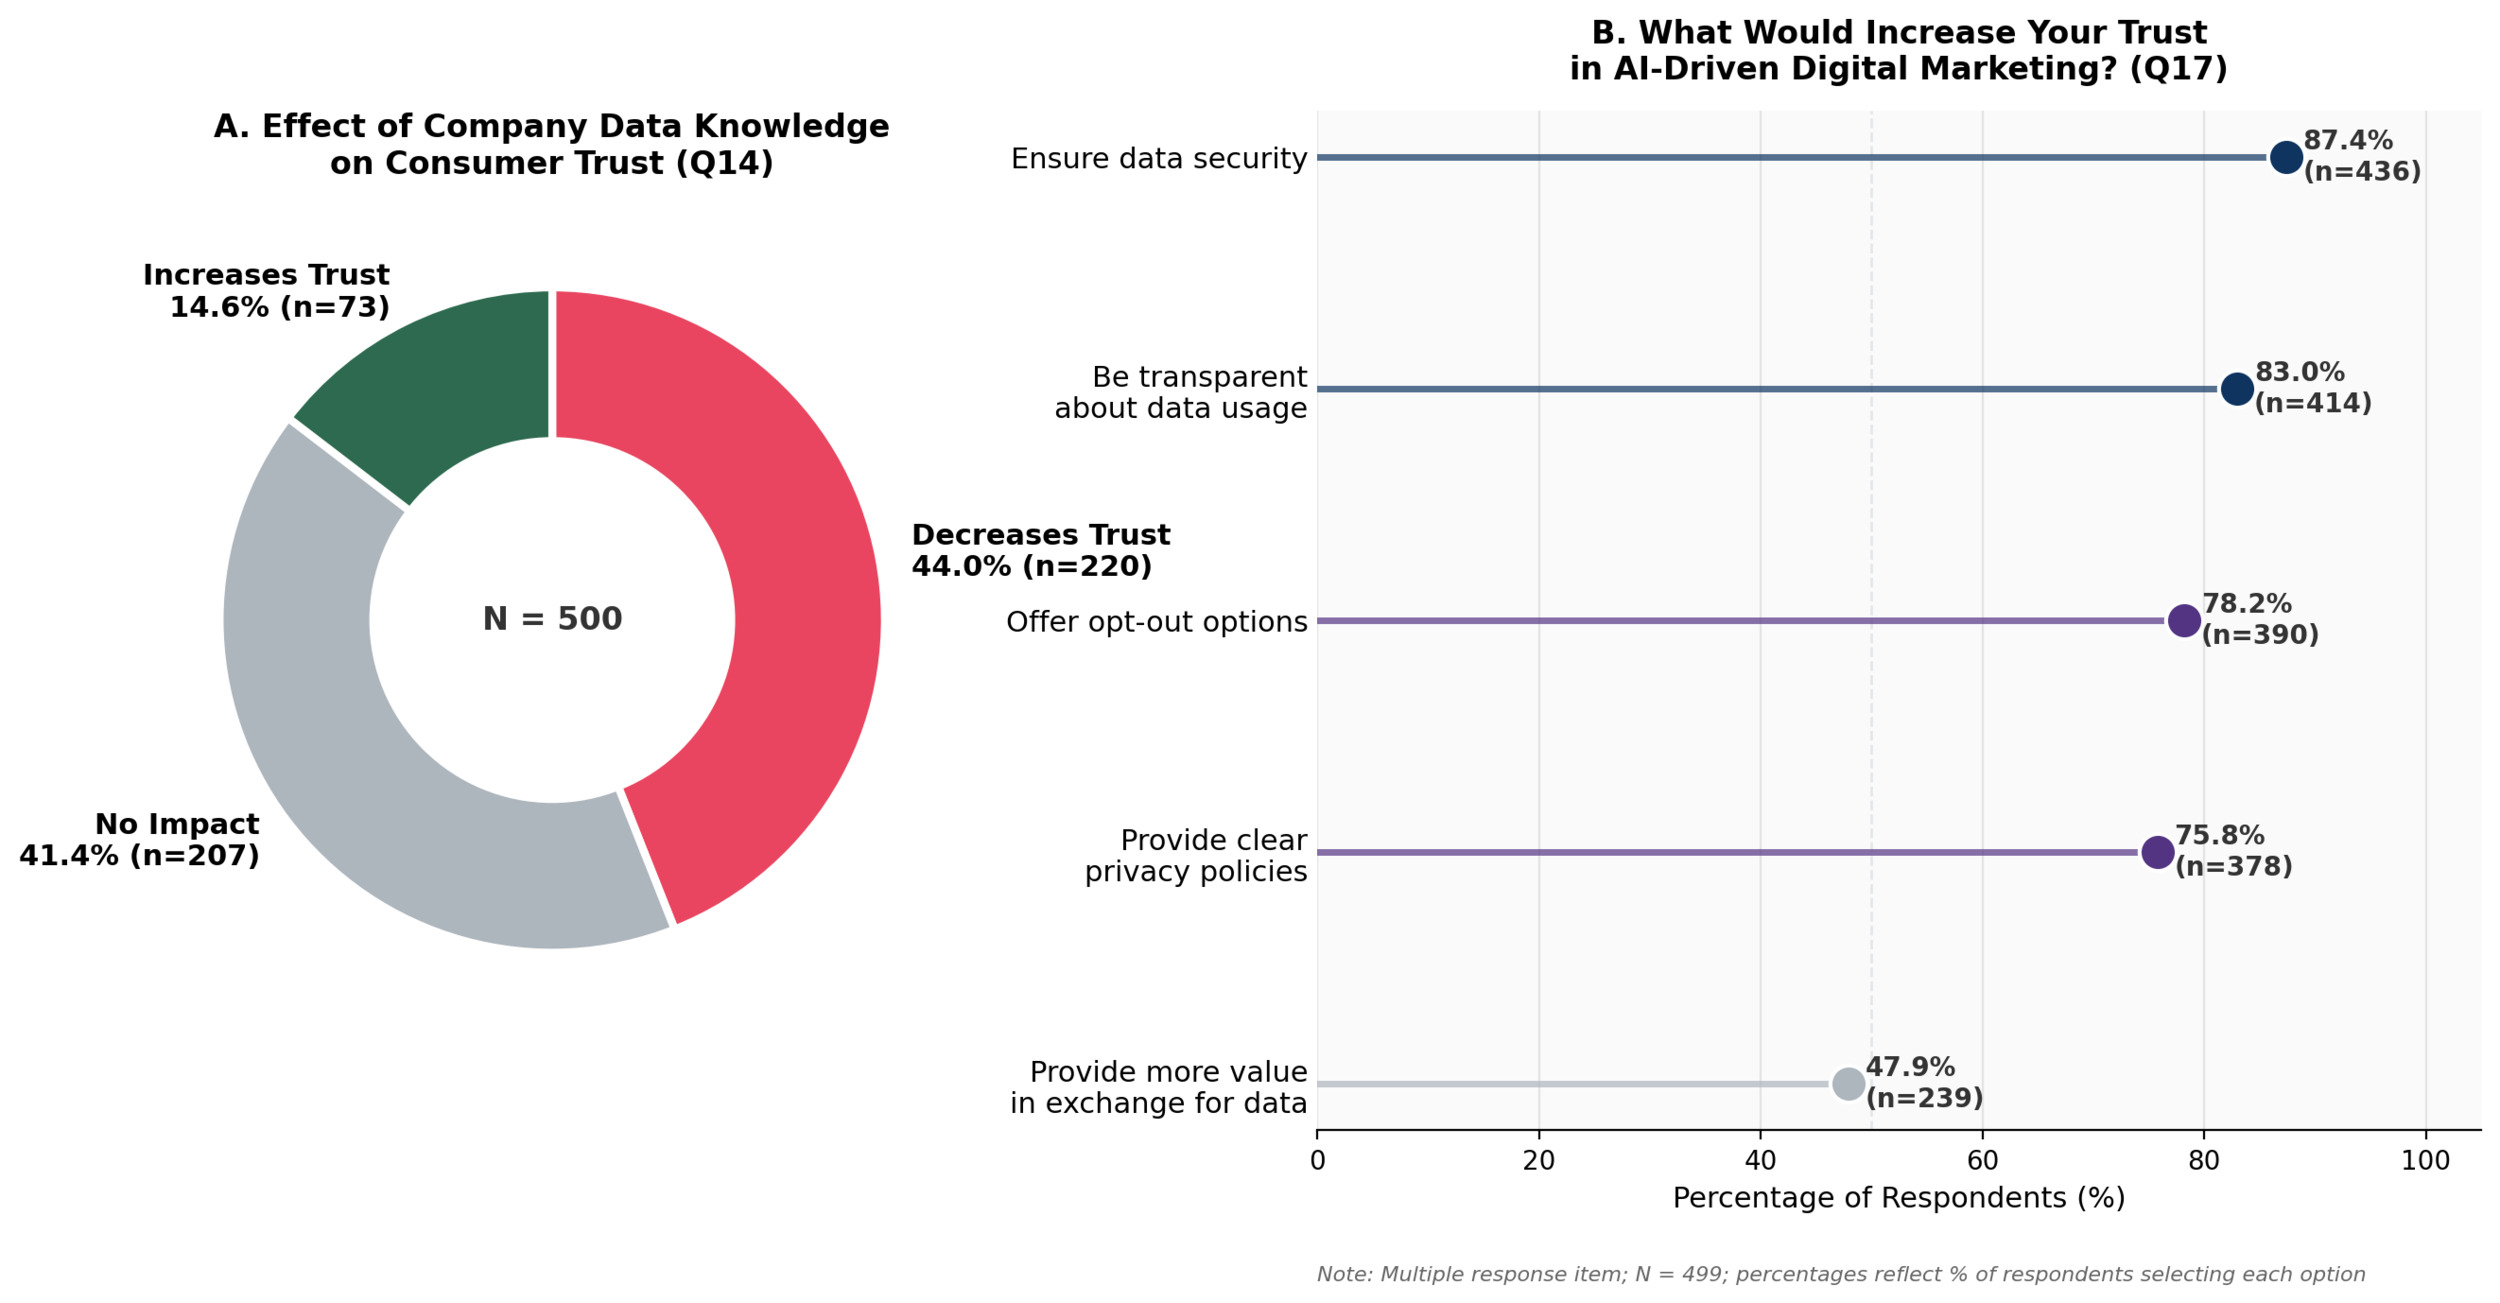
Tables 7 and 8 present privacy and trust-building preference findings.
.png)
A plurality of respondents (44.0%, n = 220) reported that greater company knowledge of their personal data decreases trust, while only 14.6% reported increased trust. When asked what would build trust in AI-driven marketing, consumers most frequently selected ensuring data security (87.4%), followed by transparency about data usage (83.0%), opt-out options (78.2%), clear privacy policies (75.8%), and providing more value in exchange for data (47.9%). Note that this last figure (47.9%) differs from the value reported in a prior version of the manuscript (64.7%), which was the result of a data extraction error; Table 8 reflects the verified counts from the final cleaned dataset.
5. Discussion
This study examined consumer trust in AI-powered digital marketing through an exploratory survey of 500 U.S. adults. The findings are organized around each research question and connected to the theoretical framework introduced in the literature review.
5.1. Research Question 1
The findings associated with RQ1 reveal the core AI trust gap: consumers accept AI marketing as functionally useful while remaining skeptical of the organizations deploying it. Trust in AI was only marginally above neutral, and outcome measures — particularly whether AI companies act in consumers’ best interests — were significantly below neutral. This pattern supports Hoff and Bashir’s (2015) and Glikson and Woolley’s (2020) observation that functional competence alone does not generate trust when users lack visibility into how systems operate. It also aligns with privacy calculus theory: even when consumers recognize the benefits of personalization, concerns about organizational intentions and data practices suppress trust and data-sharing willingness.
5.2. Research Question 2
The findings associated with RQ2 show that AI adoption is associated with a targeted rather than uniform reduction in company trust. After Bonferroni correction, only Competence and Capability differed significantly between general and AI-using companies, with small effect sizes (d = 0.145–0.225). No significant differences were found on Humanity, Integrity, Transparency, or Reliability. This selective pattern suggests that consumers question the organizational judgment and execution quality behind AI adoption — not the ethics or relational character of the firm. This finding is consistent with Glikson and Woolley’s (2020) observation that perceived competence is a separable and critical component of AI trust. Importantly, the non-significant results on human-centered dimensions should not be interpreted as establishing equivalence; they simply indicate insufficient evidence of differences in this sample.
5.3. Research Question 3
The findings associated with RQ3 show that attitudes toward AI-powered marketing are strongly interrelated, and that belief in AI’s benevolent intent and overall marketing attitude are most strongly associated with AI company trust. This is consistent with Chaudhuri and Ligas’s (2016) finding that trust, rather than general satisfaction, mediates the relationship between positive evaluations and behavioral engagement. Harman’s single-factor test result (65.8% of variance explained by the first factor) suggests some degree of common method variance, and readers should be cautious about the magnitude of reported correlations. The regression findings are best understood as identifying which attitudes travel together most closely, rather than establishing causal pathways.
5.4. Research Question 4
The findings associated with RQ4 show that AI usage frequency is statistically associated with AI company trust, but this relationship is more limited than initially suggested. Tukey HSD post hoc tests indicate that only moderate daily AI users (2–5 hours) differ significantly from light users (<2 hours); higher-usage groups are too small to draw conclusions from. This pattern is broadly consistent with Hoff and Bashir’s (2015) emphasis on accumulated experience as a key mechanism in the development of automation trust. The privacy findings reinforce the personalization paradox (Aguirre et al., 2015) and creepy marketing concerns (Moore et al., 2015): more company data knowledge tends to decrease rather than increase trust for the plurality of consumers, and value-exchange incentives rank last among trust-building preferences.
6. Managerial Implications
The findings identify several actions marketing managers can take to address the gap between consumers’ acceptance of AI’s functional benefits and their trust in the organizations deploying it. The results suggest that effective AI implementation requires more than demonstrating technological capability or delivering increasingly personalized experiences. Managers must also consider how AI use affects perceptions of organizational intent, data stewardship, consumer control, and competence.
Demonstrate consumer-oriented intent, not just personalization value. Belief that companies using AI act in consumers’ best interests was strongly associated with AI company trust. Managers should therefore communicate not only that AI is being used, but why it is being used and how consumers benefit from it. For example, firms can explain how AI helps reduce irrelevant advertising, improve recommendations, simplify service interactions, or otherwise create identifiable benefits for consumers. This shifts the emphasis from demonstrating technological sophistication to demonstrating that AI serves a legitimate consumer purpose.
Make data security and transparency visible. Consumers identified data security (87.4%) and transparency about data use (83.0%) as the two most frequently selected actions that would increase their trust in AI-driven marketing. Opt-out options (78.2%) and clear privacy policies (75.8%) were also selected substantially more often than providing greater value in exchange for personal data (47.9%). This pattern suggests that trust may be built more effectively through risk reduction, transparency, and consumer control than through attempts to compensate consumers for increased data collection. Managers should therefore make privacy protections visible at the points where data are collected and AI-driven personalization occurs, clearly communicating what information is collected, how it is used, and how it is protected.
Preserve meaningful consumer control. The strong preference for opt-out options suggests that consumers value the ability to control their participation in AI-driven personalization. Managers should make personalization and data-use controls easy to locate, understand, and modify rather than treating them solely as legal or privacy-policy disclosures. Providing consumers with meaningful choices regarding personalization, data use, and AI-mediated interactions may also help reduce perceptions that personalization represents surveillance rather than service. This approach is consistent with the broader privacy findings, in which 44.0% of respondents indicated that greater company knowledge of their personal data decreases trust, compared with only 14.6% who indicated that it increases trust.
Do not assume that AI adoption signals greater organizational competence. AI-using companies were rated significantly lower on competence and capability than companies generally, although the observed effect sizes were small. No significant differences after correction were found on the remaining trust dimensions. For managers, these findings suggest that adopting AI should not be assumed to enhance consumer perceptions of organizational expertise. Firms may benefit from demonstrating the quality and reliability of AI-supported decisions, maintaining appropriate human oversight, and providing accessible human support when automated systems fail or produce unsatisfactory results. AI implementation should therefore be evaluated not only in terms of efficiency and technological performance but also in terms of how it affects perceptions of the organization using the technology.
Build familiarity among consumers with limited AI experience. Moderate daily AI users (2-5 hours) reported significantly higher AI company trust than light users (<2 hours), although the cross-sectional design does not establish whether greater AI use produces greater trust or whether consumers who are more trusting of AI are more likely to use it. Managers could nevertheless consider introducing consumers to AI through low-risk, easily understood applications before asking them to rely on AI in interactions involving more sensitive information or consequential decisions. Product discovery, basic recommendations, and optional AI-assisted customer service may provide opportunities for consumers to become more familiar with AI-enabled interactions. Because the present findings are associative rather than causal, the effectiveness of such strategies should be tested rather than assumed.
Consider existing brand trust when implementing AI personalization. General company trust and AI company trust were very strongly correlated (r = .874), suggesting that consumers’ existing perceptions of companies are closely related to how they evaluate those companies in an AI context. However, the magnitude of this relationship should be interpreted cautiously given the evidence of potential common method bias in the study. Managers should therefore view AI trust as part of broader brand and relationship management rather than as an isolated technology issue. Organizations with weaker baseline consumer trust should be particularly cautious about assuming that sophisticated AI personalization will independently overcome existing trust concerns.
Manage the AI trust gap as a strategic marketing issue. Collectively, these findings suggest that the central managerial challenge is not convincing consumers that AI-powered marketing is useful; respondents already recognized its functional benefits. Rather, the challenge is converting that perceived usefulness into trust in the organizations deploying the technology. Managers should therefore evaluate AI marketing initiatives not only through traditional performance measures such as engagement, conversion, personalization effectiveness, and efficiency, but also through their effects on consumer trust. Measures of perceived transparency, data security, consumer control, benevolent intent, and organizational competence can help firms identify whether AI implementation is strengthening or weakening customer relationships. Ultimately, effective AI marketing may depend less on demonstrating what the technology can do and more on demonstrating that it is being used responsibly, transparently, and in ways that consumers perceive as serving their interests.
7. Limitations and Future Research
This study has several important limitations. First, the cross-sectional design does not support causal inference. The associations between AI usage and trust, and between attitudinal predictors and AI company trust, could reflect selection effects rather than causal relationships. Second, Harman’s single-factor test indicated potential common method bias (first factor = 65.8%), a consequence of collecting all perceptual data from the same respondents in the same survey. Future research should consider multi-source designs or procedural remedies such as temporal separation of predictors and outcomes.
Third, the sample is limited to U.S. adults, restricting cross-cultural generalizability. Fourth, the survey asked about ‘AI-powered digital marketing’ generally, without specifying a particular application; different respondents may have had different technologies in mind, introducing heterogeneity in the referent construct. Fifth, the regression model included only attitudinal predictors; personality traits, prior data breach experiences, and industry-specific factors were not measured.
Sixth, several trust-building preference response categories (Q17) had a small number of additional responses beyond the five main categories (Q17_6: n = 17, 3.4%) that were not analyzed in the main body of the paper. Future research should examine the full range of consumer-identified trust-building actions more comprehensively.
Future research could address these limitations through longitudinal or experimental designs that establish causal direction, cross-national comparisons, and studies that examine specific AI applications (e.g., recommendation systems, chatbots, targeted advertising) rather than AI-powered marketing in general. Structural equation modeling could also test the theoretical relationships implied by the present correlation and regression findings.
8. Conclusion
This study documents a clear AI trust gap in consumer perceptions of AI-powered digital marketing: consumers accept the functional usefulness of AI while remaining skeptical about the organizations deploying it. AI-using companies are specifically penalized on competence-related trust dimensions, not on ethical or relational ones. Belief in AI’s benevolent intent and overall attitude toward AI marketing are the attitudes most strongly associated with AI company trust, while age and gender show no significant association. Moderate daily AI users report higher trust than light users, suggesting a role for experience in building comfort with AI marketing over time.
These findings suggest that companies hoping to build consumer trust in AI-powered marketing should invest in visible governance, clear communication of benevolent intent, and data security assurances rather than expanded personalization or incentive programs. The gap between AI marketing practice and consumer trust is real, measurable, and — these findings suggest — unlikely to close without deliberate attention to how, not just how well, AI is deployed.